Maximus, Inc.'s management explains the business in its own materials. The slides below do the most of that work, pulled from the documents preserved in Sources. Each source link opens the complete presentation at that slide in a new tab.
Management's fullest current overview of the business — what it does, who it serves, how it gets paid, and its economic model — in one deck. · Open the full document →
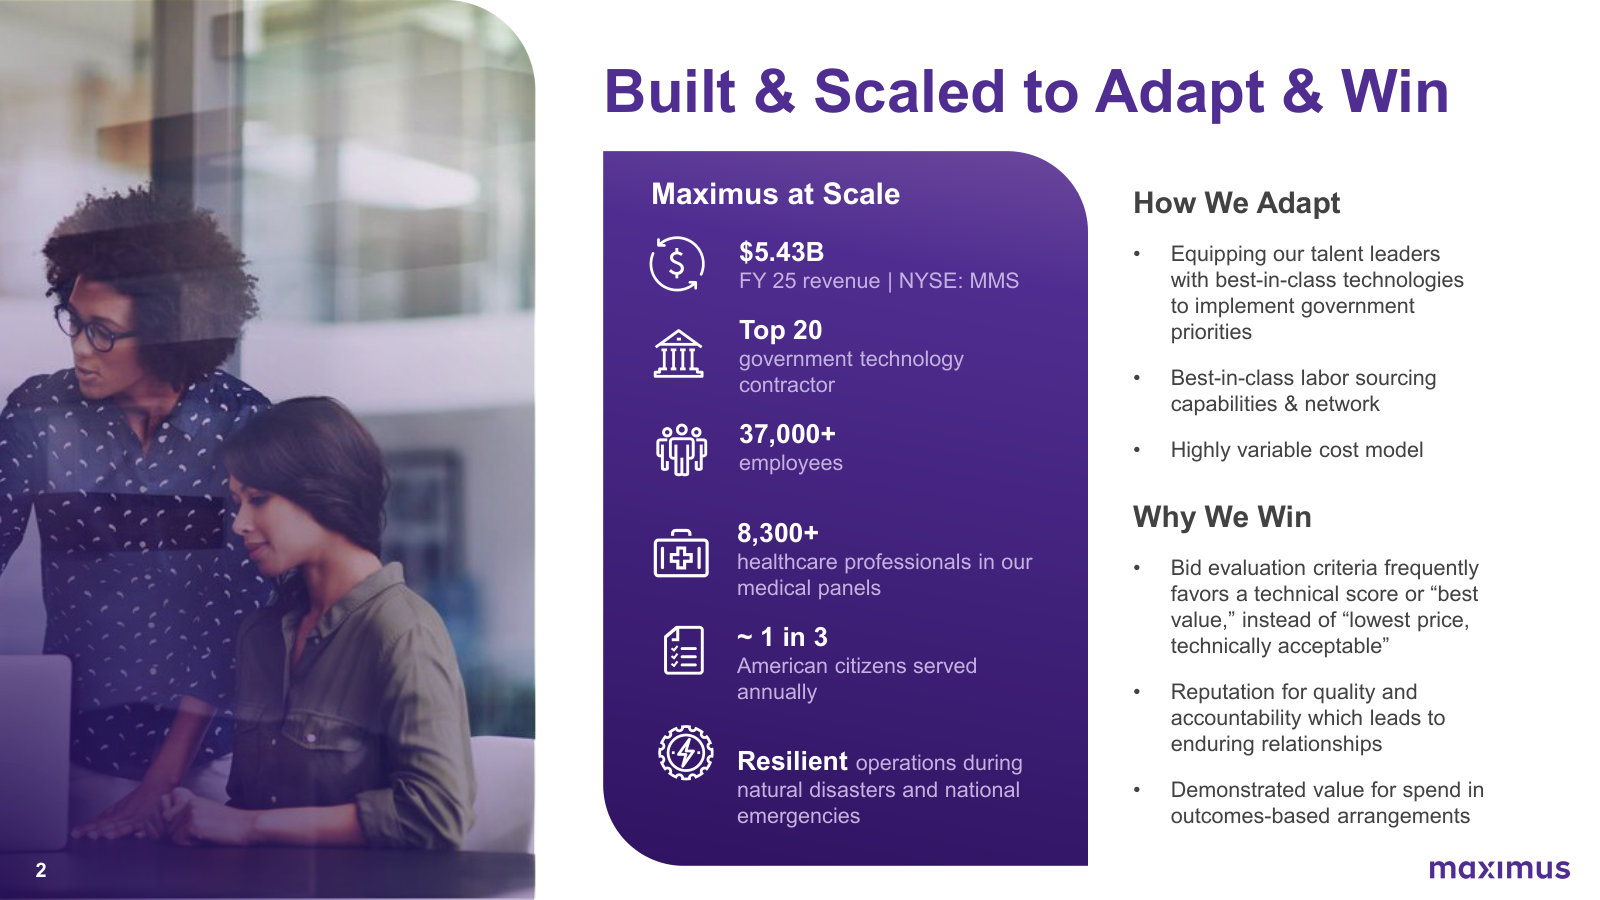
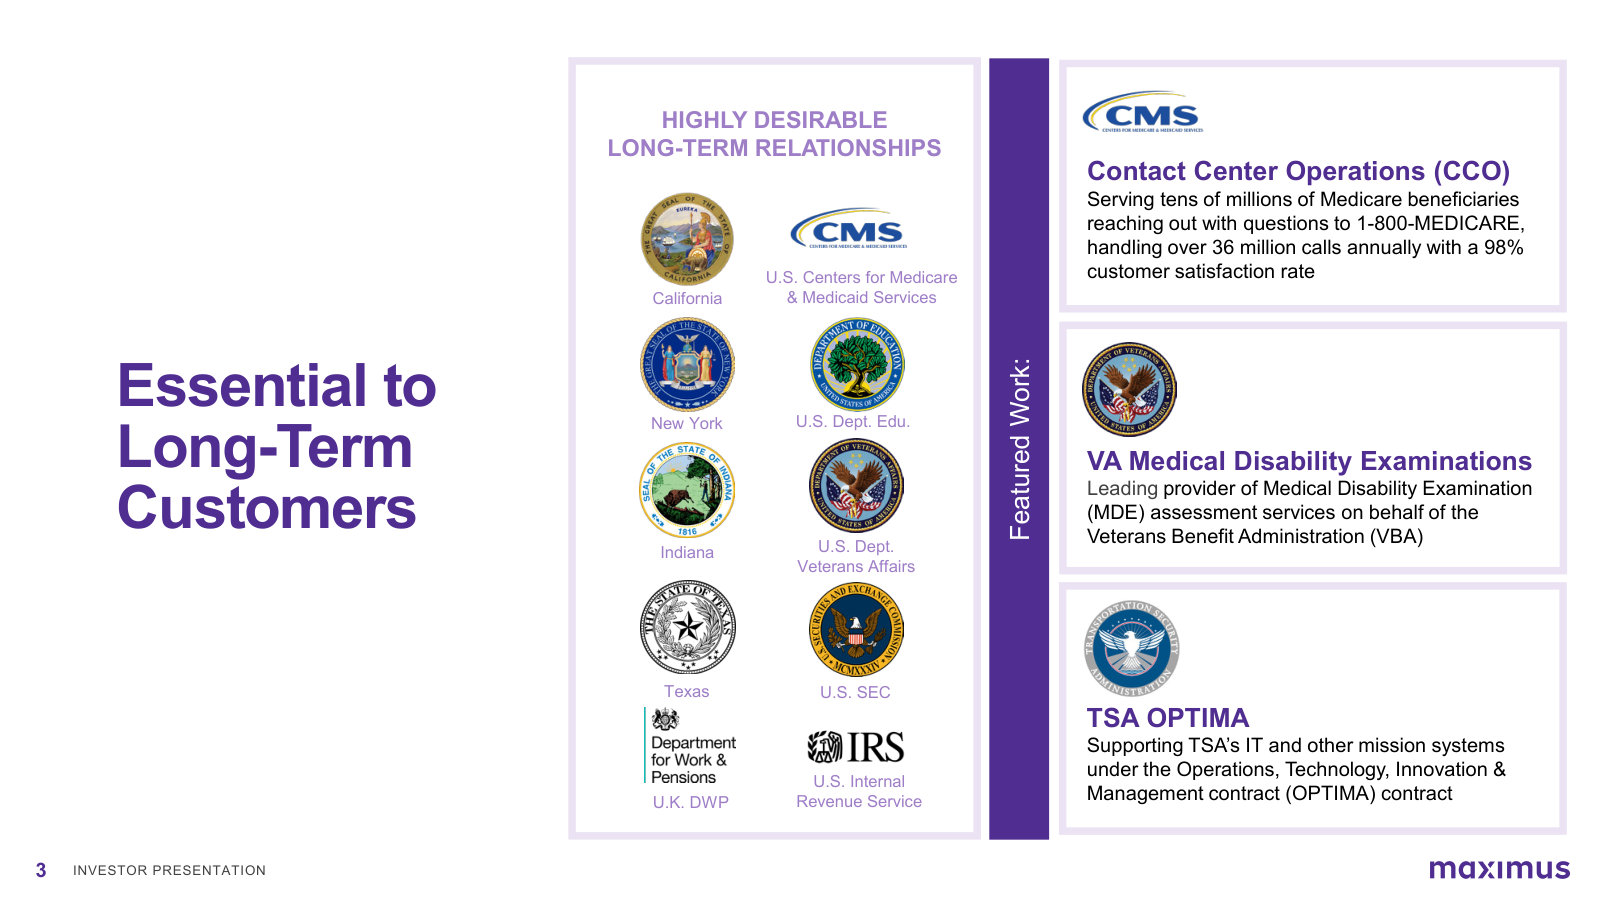
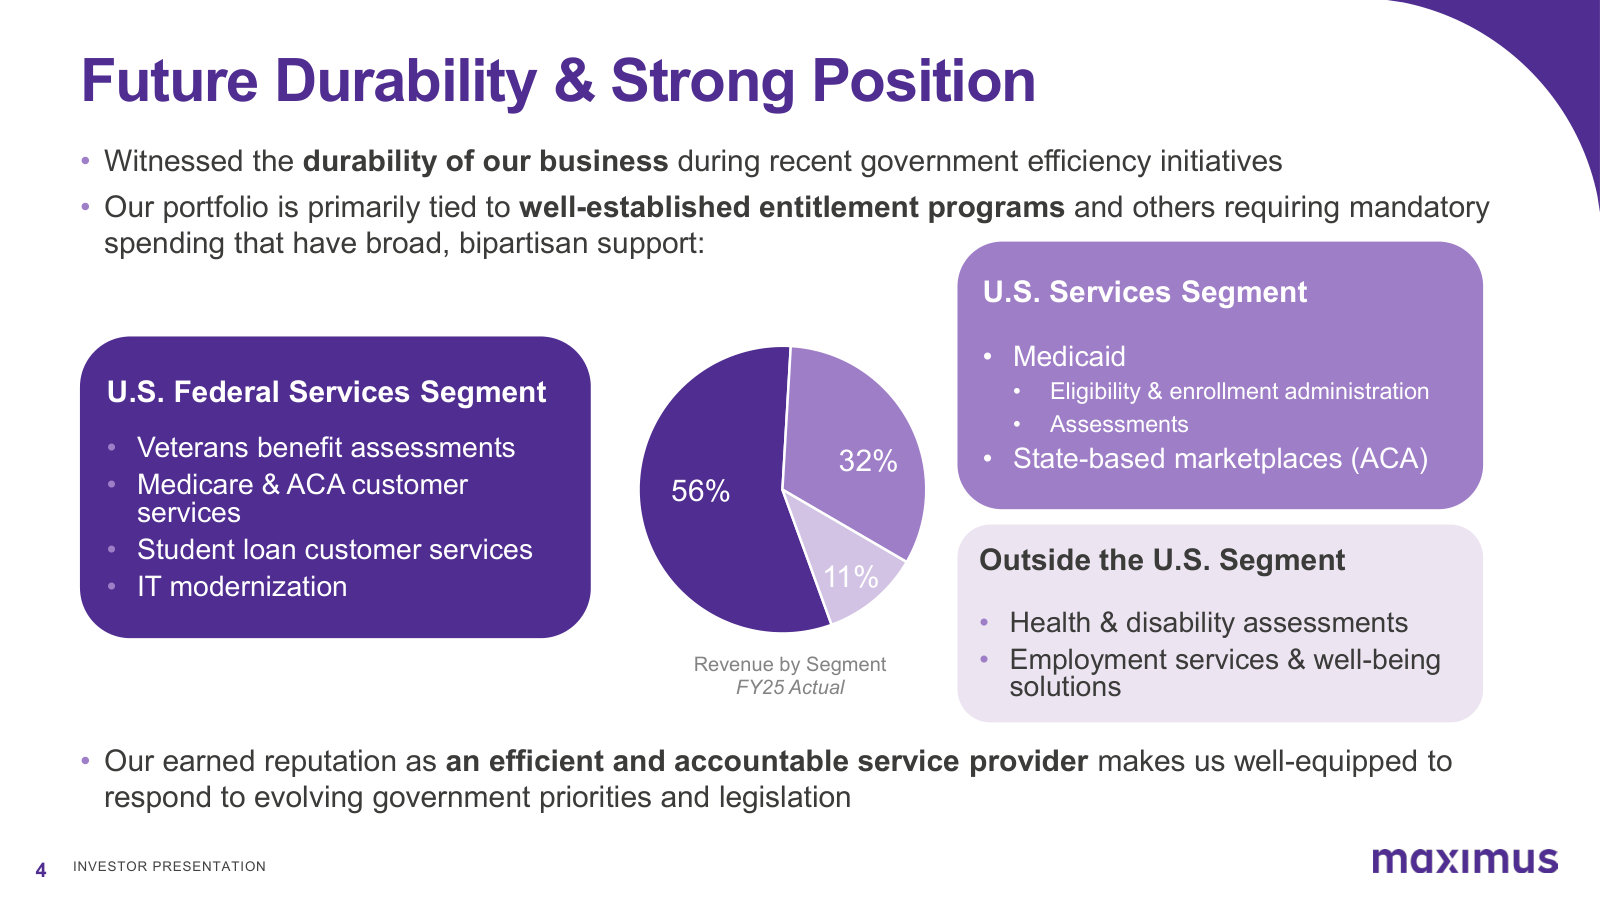
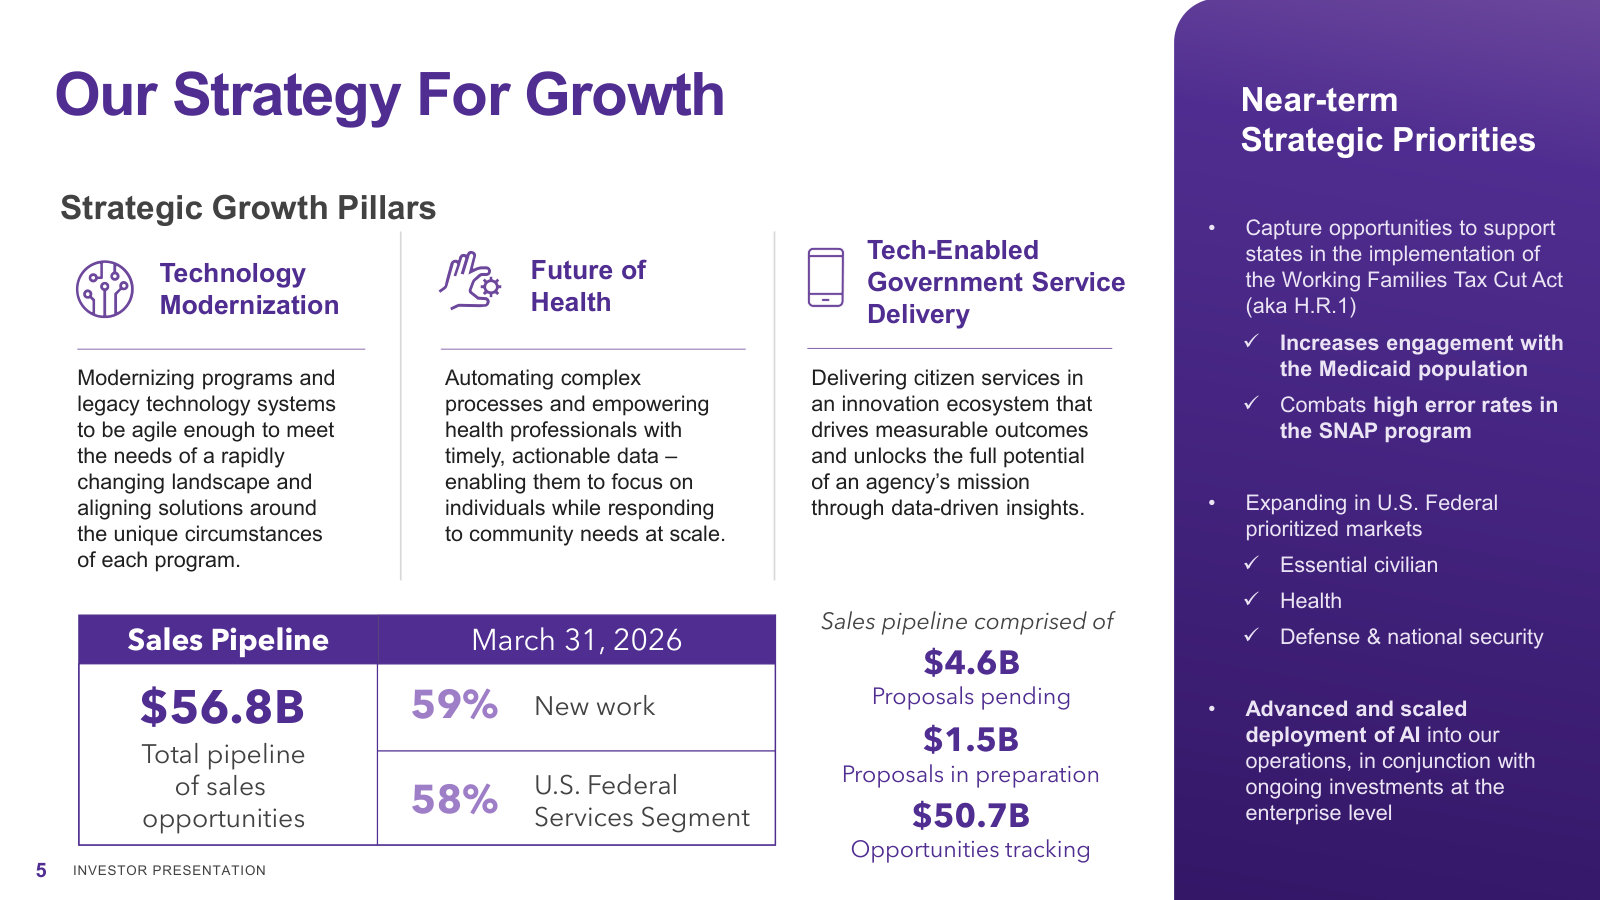
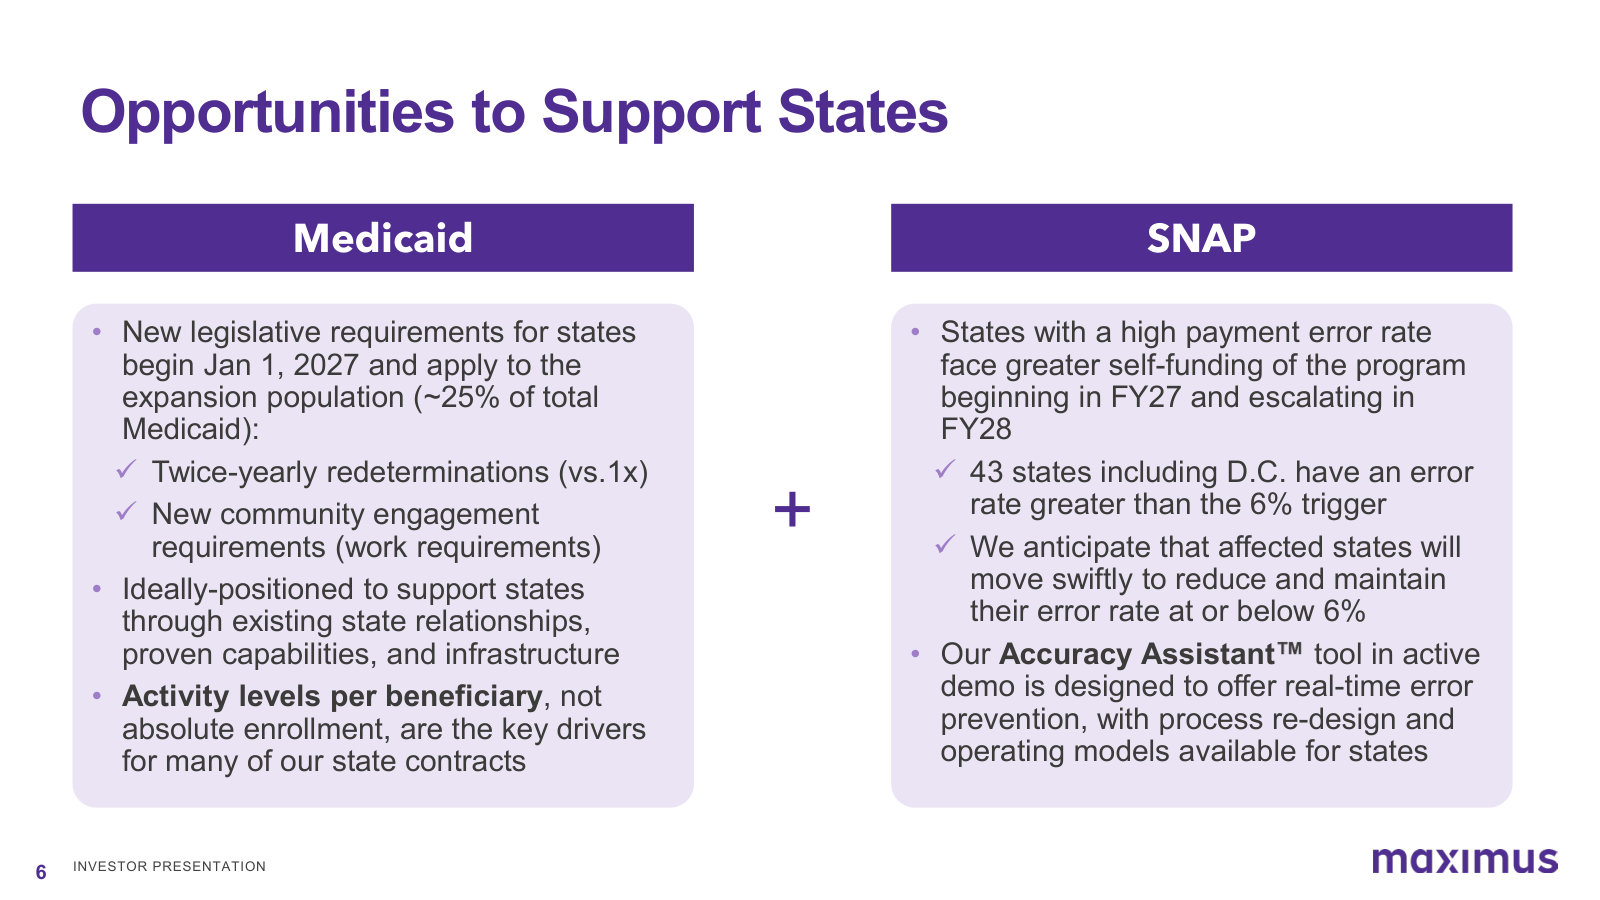
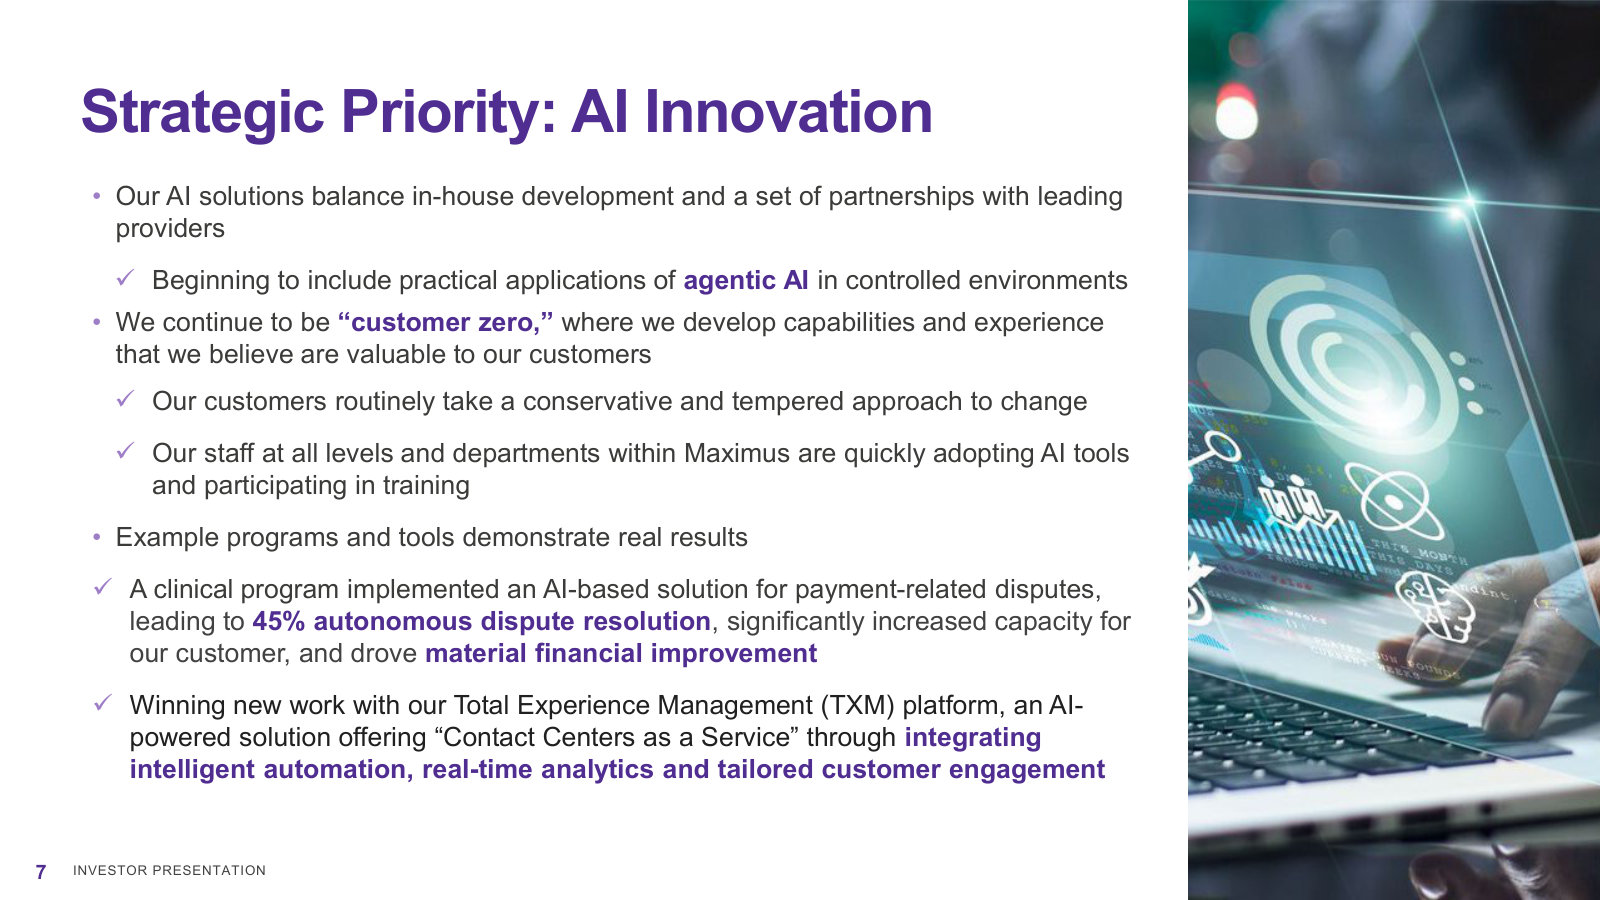
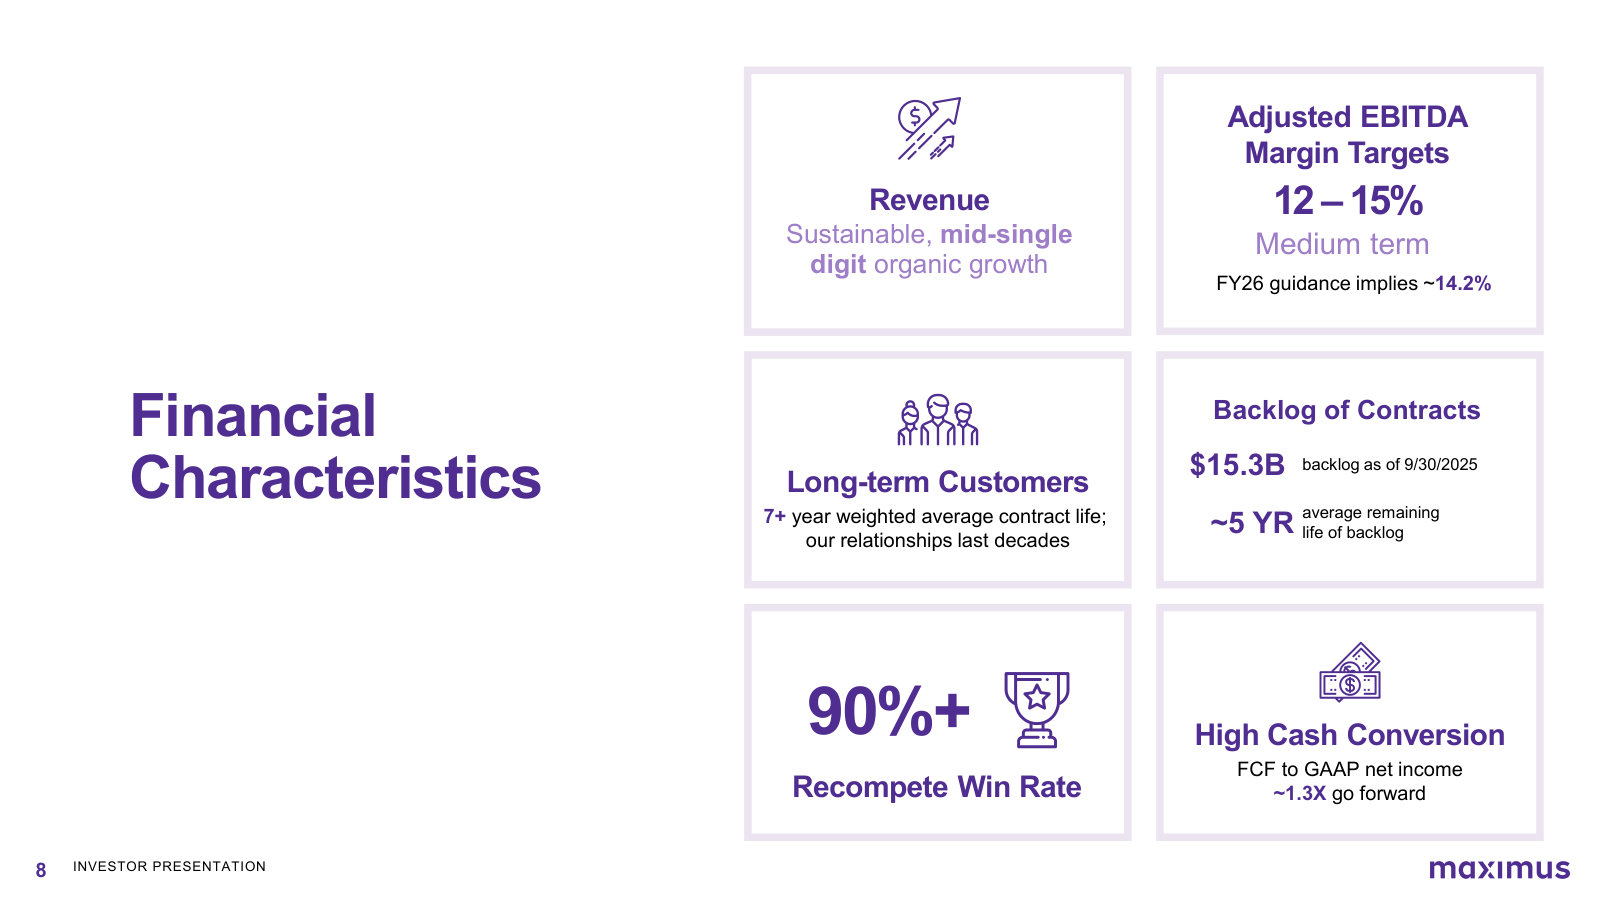
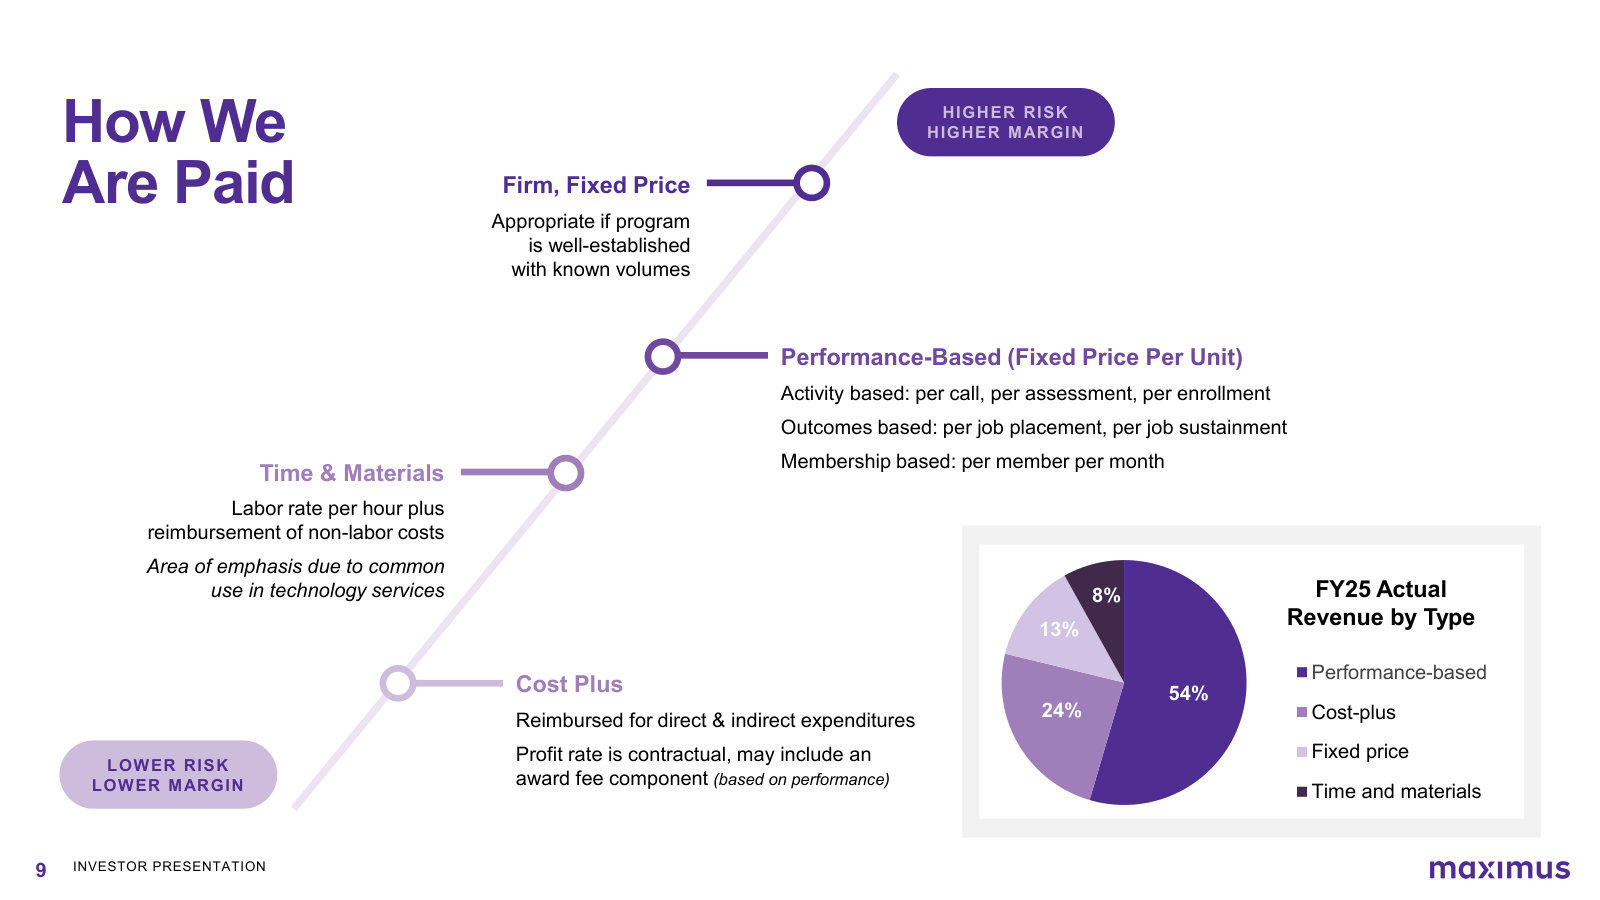
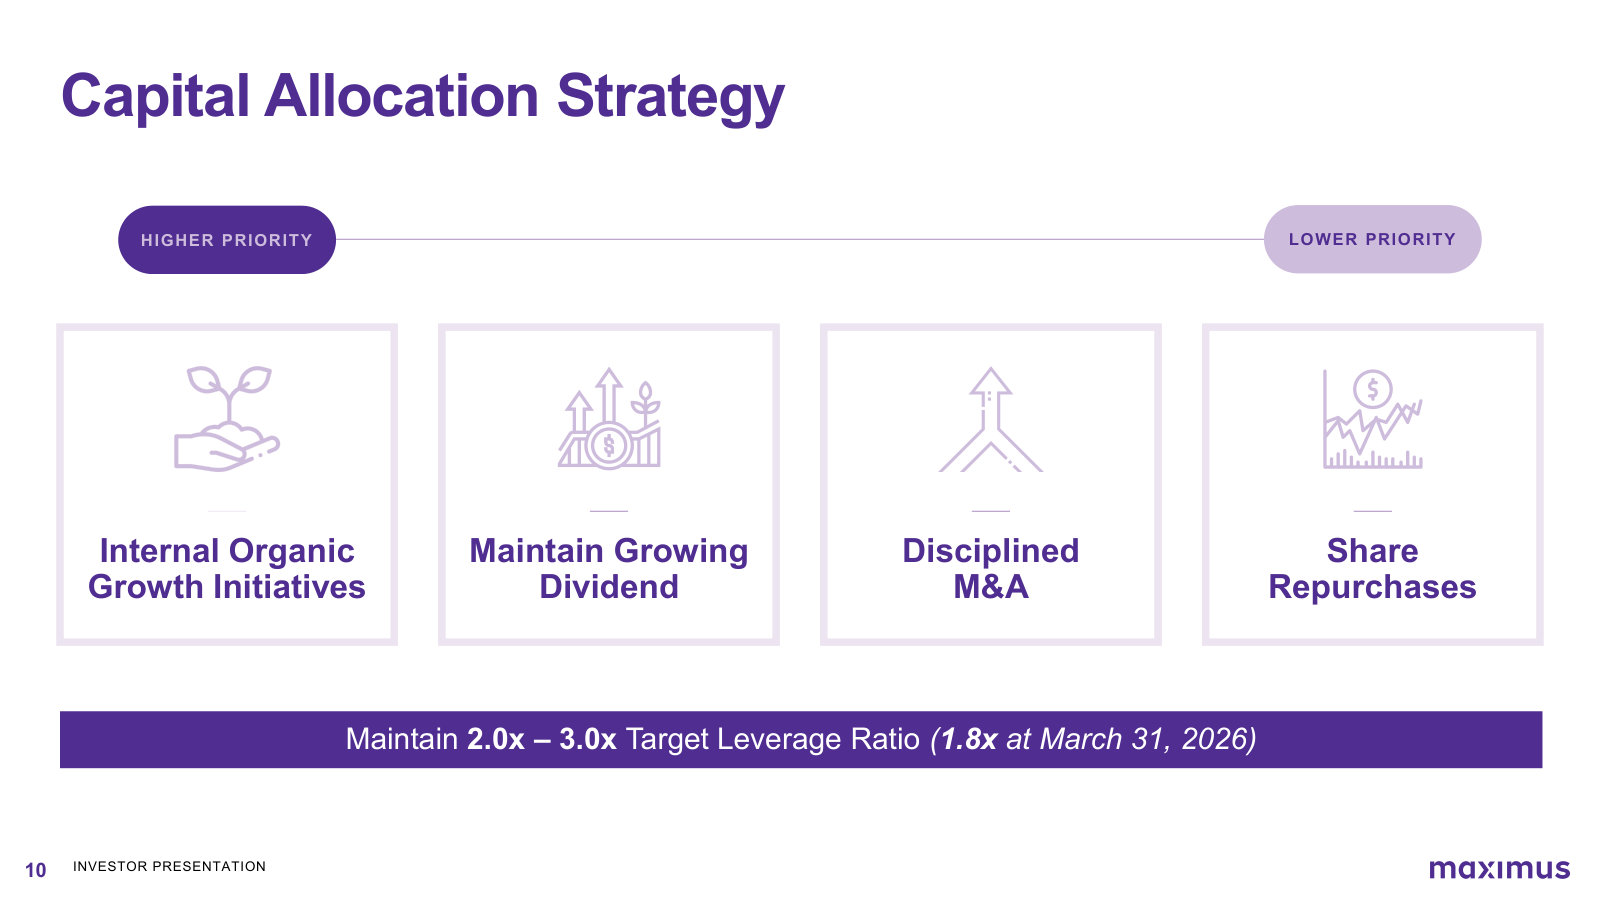
p. 2 — Maximus at scale: $5.43B FY25 revenue, a top-20 government tech contractor serving ~1 in 3 Americans, and why it wins on best-value bids. · Open the full presentation →p. 3 — The marquee, long-tenured customers — CMS, Veterans Affairs, IRS, SEC, U.K. DWP and states — with three flagship contracts. · Open the full presentation →p. 4 — The three reporting segments and what each does, with the FY25 revenue split: Federal 56%, U.S. Services 32%, Outside the U.S. 11%. · Open the full presentation →p. 5 — The three growth pillars, the $56.8B sales pipeline, and the near-term policy-driven priorities management is chasing. · Open the full presentation →p. 6 — How new Medicaid and SNAP rules — twice-yearly redeterminations, work requirements, payment-accuracy penalties — create demand for Maximus. · Open the full presentation →p. 7 — The AI strategy: acting as its own "customer zero," with proof points like 45% autonomous dispute resolution and the TxM platform. · Open the full presentation →p. 8 — The economic model: mid-single-digit growth, 12-15% EBITDA margin target, 90%+ recompete win rate, $15.3B backlog, ~1.3x cash conversion. · Open the full presentation →p. 9 — How Maximus is paid — the contract-type spectrum from cost-plus to fixed-price mapped to risk and margin, with the FY25 revenue-by-type mix. · Open the full presentation →p. 10 — Capital allocation priorities in order — organic growth, dividend, M&A, buybacks — against a 2.0-3.0x target leverage ratio. · Open the full presentation →
The annual capstone deck: the actual segment P&L, cash flow and balance sheet behind the overview, plus FY2026 targets. · Open the full document →
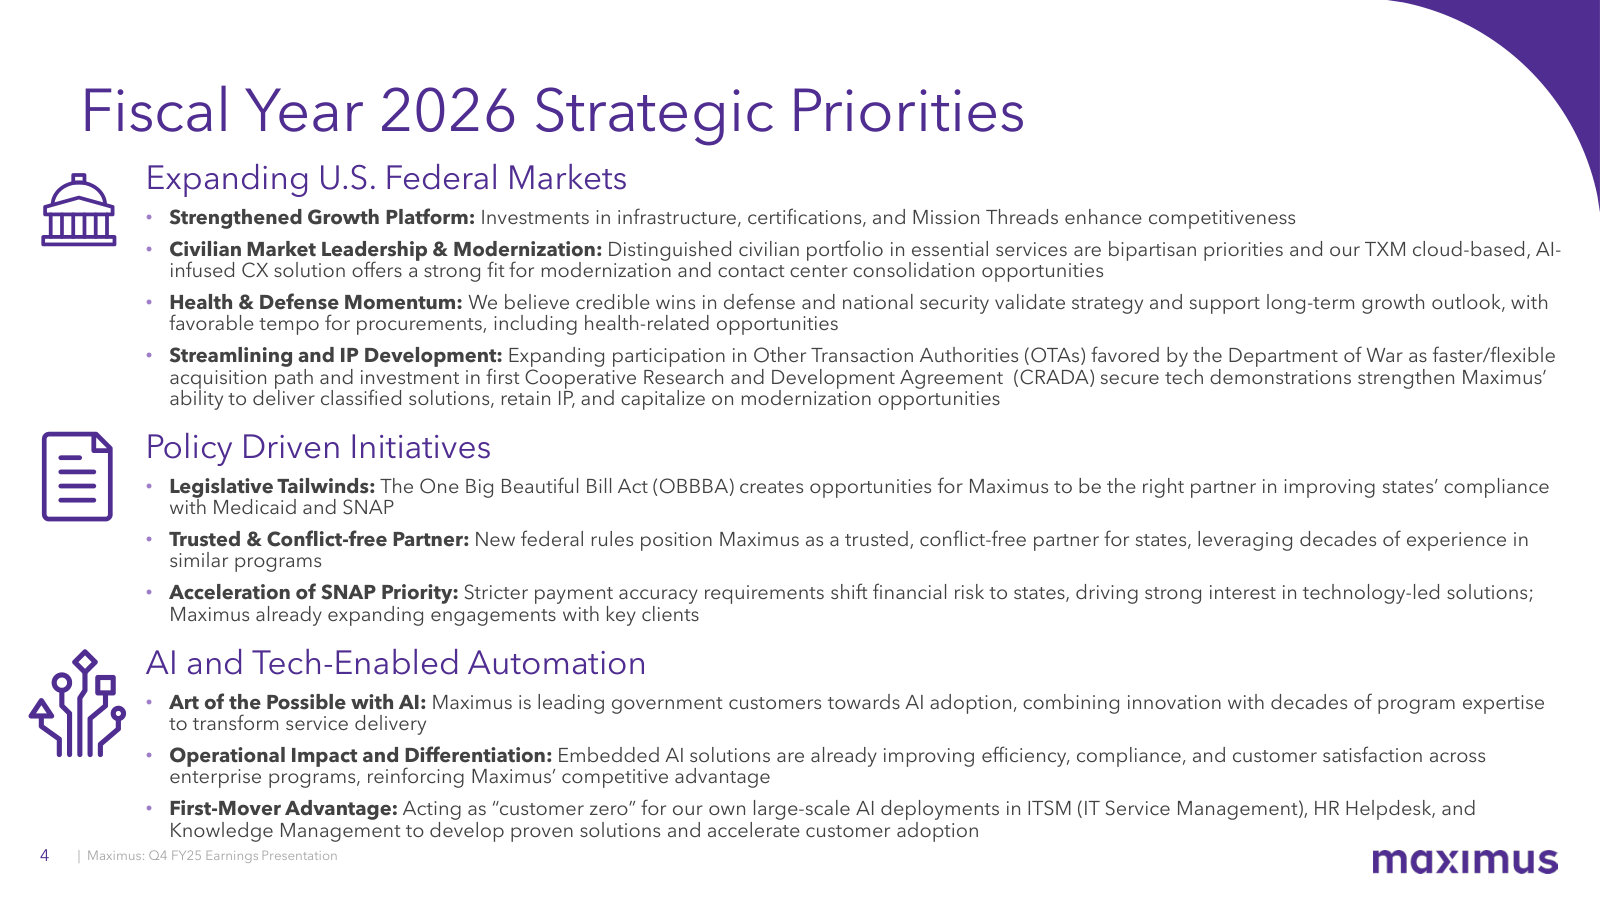
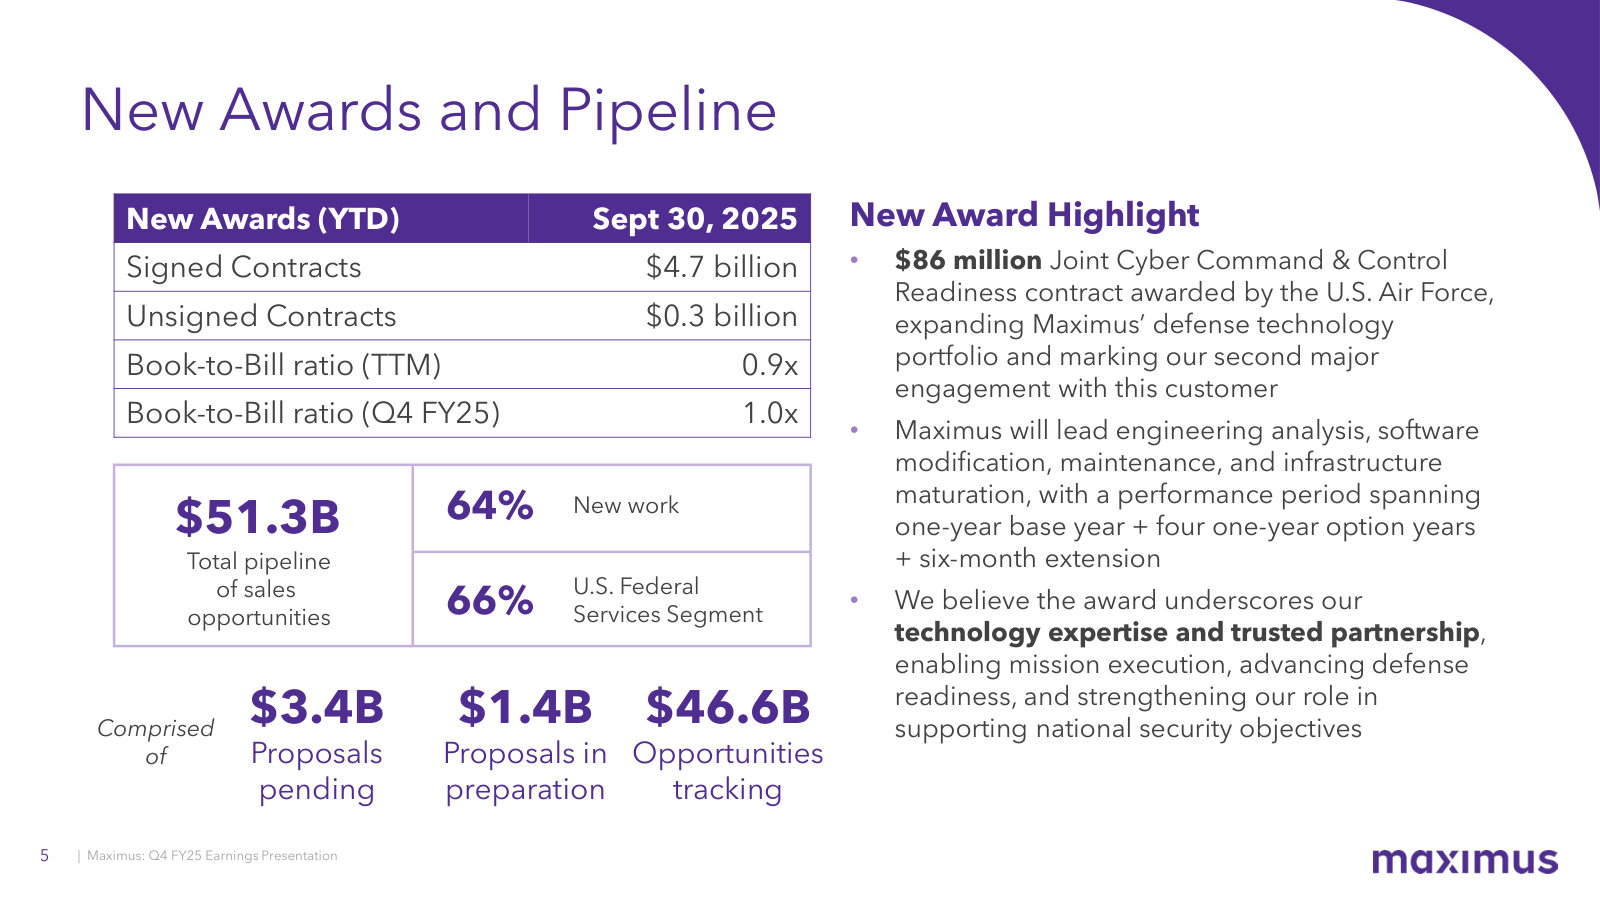
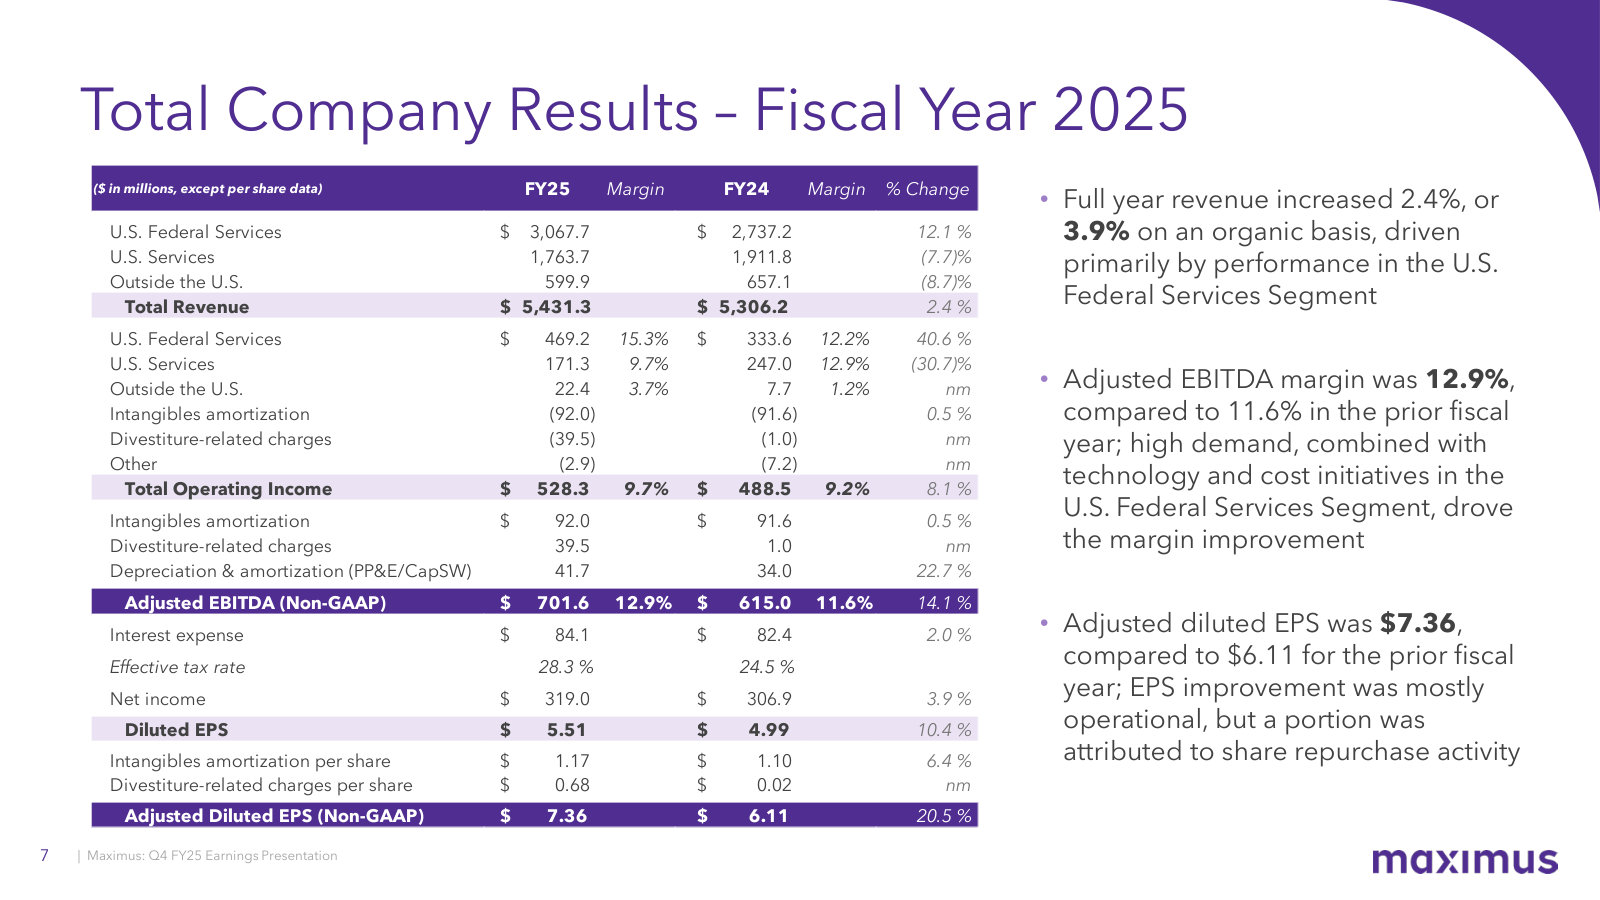
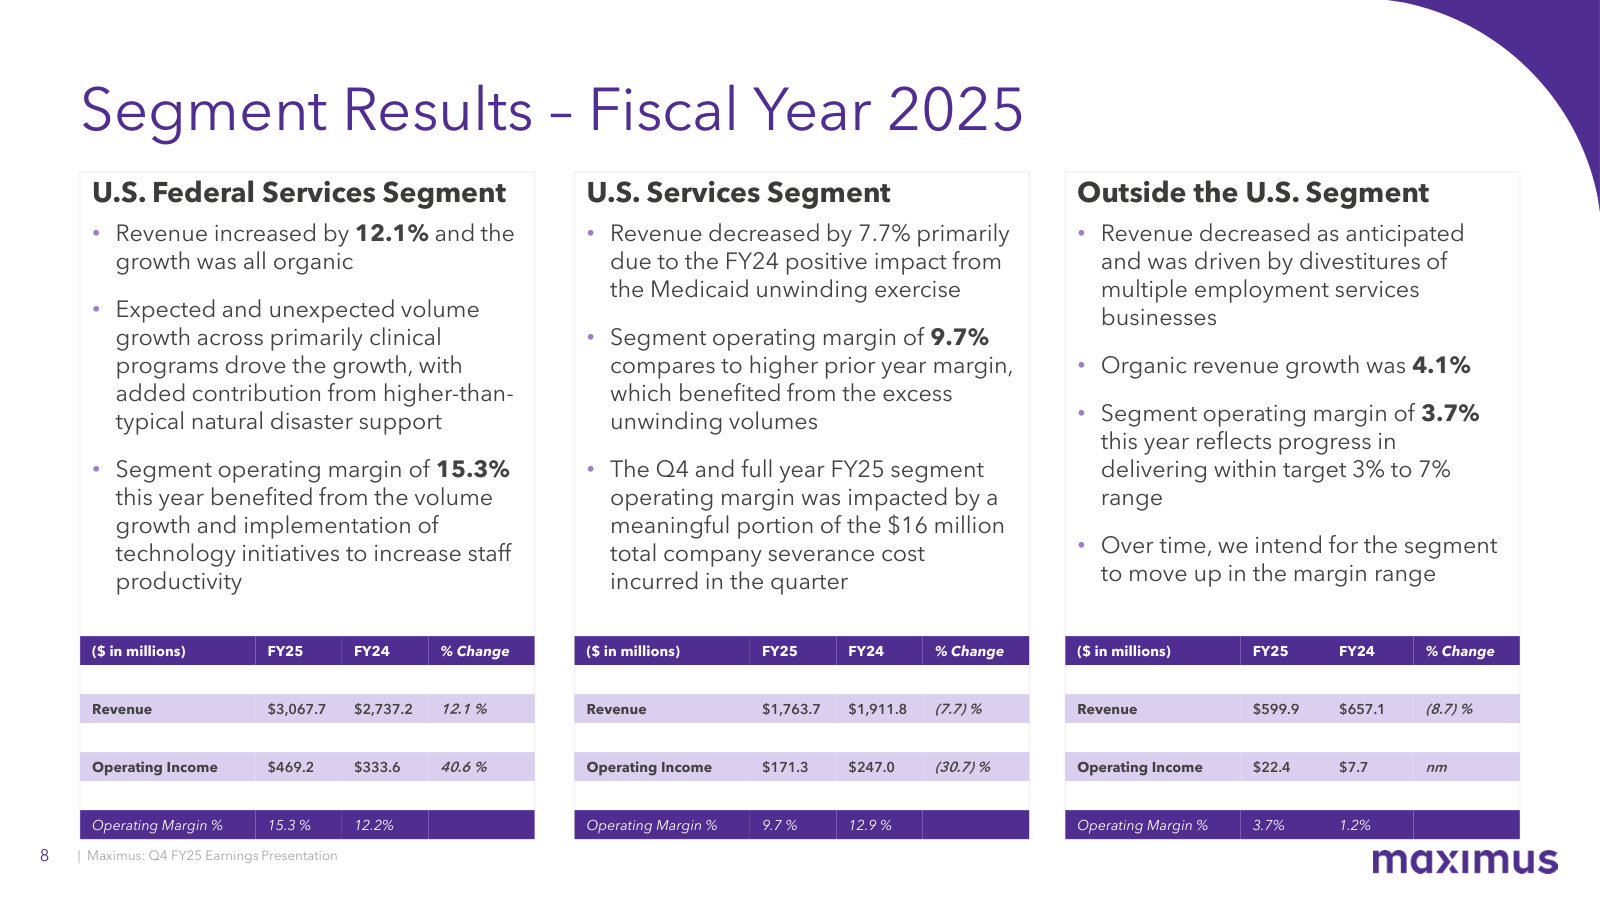
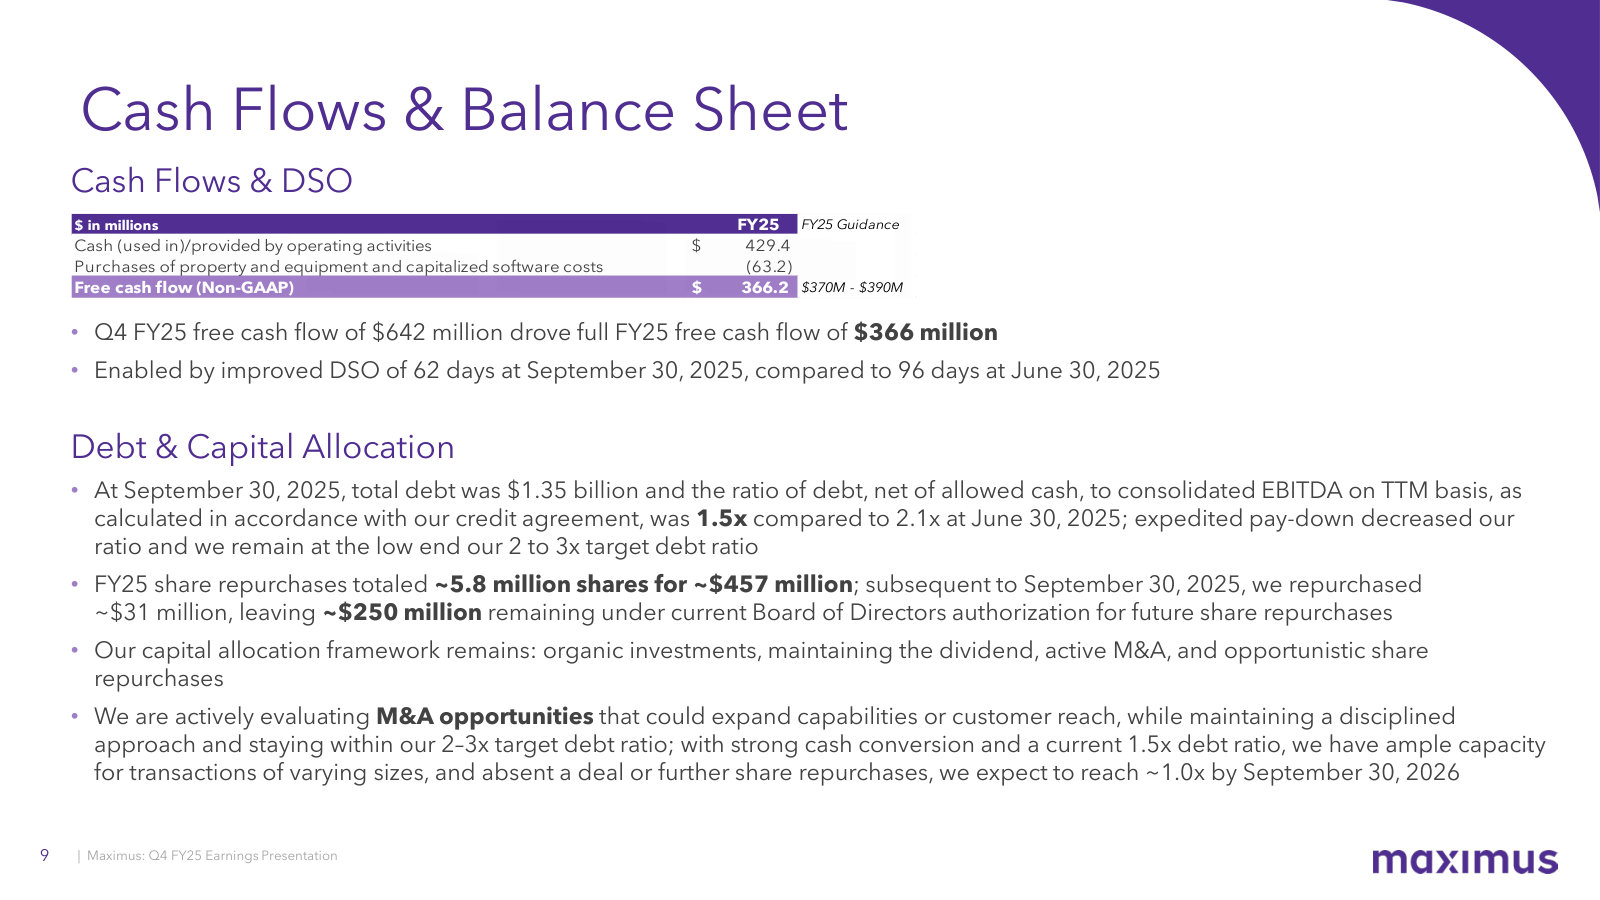
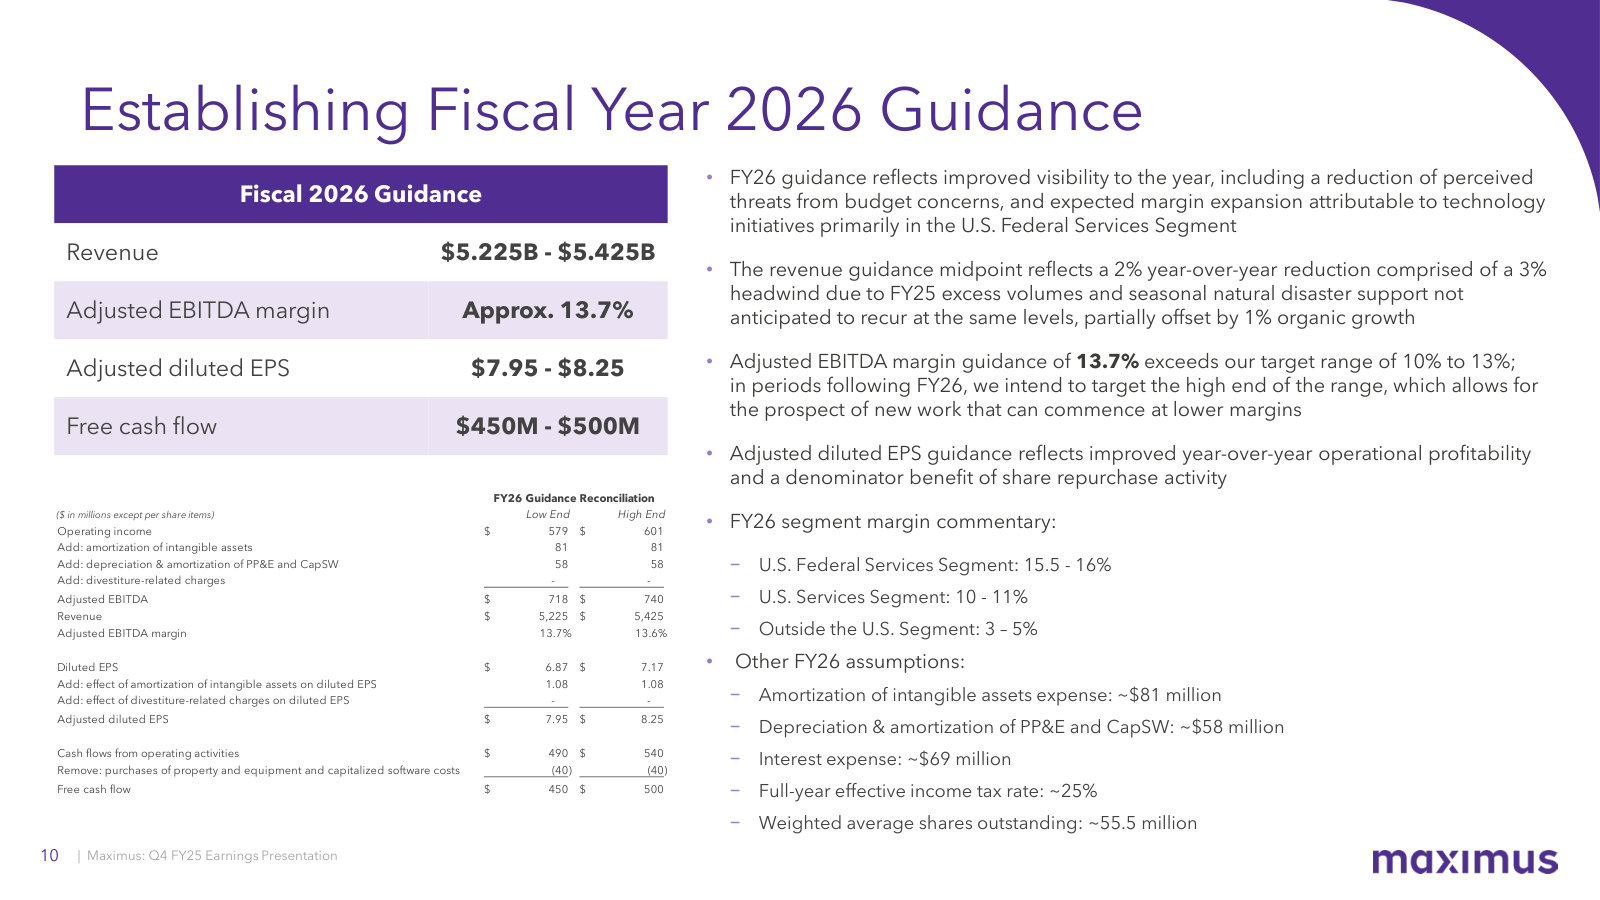
p. 4 — The FY2026 strategy laid out in prose — federal-market expansion, policy tailwinds (OBBBA, Medicaid, SNAP), and AI-enabled automation. · Open the full presentation →p. 5 — How the backlog gets refilled: $4.7B new awards, 0.9x TTM book-to-bill, and a $51.3B pipeline broken down by stage. · Open the full presentation →p. 7 — The full FY2025 income statement — segment revenue, the adjusted-EBITDA bridge, 12.9% margin and $7.36 adjusted EPS. · Open the full presentation →p. 8 — Segment economics side by side: Federal Services revenue +12.1% at 15.3% margin, versus declines in U.S. Services and Outside the U.S. · Open the full presentation →p. 9 — Cash generation and the balance sheet — $366M FCF, DSO down to 62 days, 1.5x leverage, and $457M of FY25 buybacks. · Open the full presentation →p. 10 — FY2026 guidance and the reconciliation behind it: $5.2-5.4B revenue, ~13.7% EBITDA margin, and per-segment margin targets. · Open the full presentation →
Fiscal 2026 Second Quarter Earnings Call — Q2 FY2026 · 11 pages · The latest quarterly deck, with unique slides on technology-enabled program-integrity/fraud work and the maximus|TxM AI platform. · Open →
Fiscal 2024 Year End Earnings Call — FY2024 · 16 pages · The prior full-year deck — the FY2024 segment baseline the FY2025 numbers are measured against. · Open →
Fiscal 2023 Year End Earnings Call — FY2023 · 17 pages · An earlier year-end deck for the multi-year trajectory of segments, margins and cash flow. · Open →