Full Report
The numbers behind Maximus, Inc.: as-reported financial statements and company metrics for FY2021–FY2025, traced to the source filings, opened with the share-price history those statements have to justify. Every linked figure opens the exact page of the filing it was printed on, with the statement row highlighted. Amounts in US$ thousands unless noted.
Reading notes: All figures are in thousands of US dollars exactly as printed in the 10-K statements (units line: 'in thousands, except per share amounts'), except per-share and backlog rows. Each fiscal year FY2021-FY2025 is cited to its own Form 10-K (Consolidated Statements of Operations / Balance Sheets / Cash Flows and the Note 3 Business Segments table). FY2022 revenue and segment-profit cells are cited to the FY2023 10-K's comparative column (Note 3 table on p.81). Long-term record: FY2019 and FY2020 are cited to comparative columns of the FY2021 Form 10-K; FY2016-FY2018 are from the standardized data feed (SEC XBRL) and shown without page links (no filing in the corpus). Segment operating income: FY2025 is the single 'Segment operating income' line printed in the new ASU 2023-07 segment table (p.84). FY2021-FY2024 use the per-segment 'Operating income/(loss)' rows; the total segment operating income for those years is the sum of the three segments (components cited, total computed).
Share Price — Full Available History — 29 Years
The stock closed at $58.30 on Jul 17, 2026 — up 5,082% over the window shown (+14.5% a year), trading between $1.08 and $98.93. At that close the stock trades at 11× FY2025 diluted EPS as reported below.
Source: market price feed, monthly closes, sampled from 7,318 source observations, Jun 1997–Jul 2026. Price return only, excludes dividends. Prices are split-adjusted (1:2 on Jul 01, 2011; 1:2 on Jul 01, 2013).
FY2025 at a Glance
Revenue (US$ thousands)
Operating income (US$ thousands)
Net income (US$ thousands)
Diluted EPS
Source: FY2025 consolidated statements [1] [2] [3] [4]. Click any linked figure to open the filing page with the row highlighted.
Revenue by Business Segment
| Revenue by Business Segment | FY2021 | FY2022 | FY2023 | FY2024 | FY2025 |
|---|---|---|---|---|---|
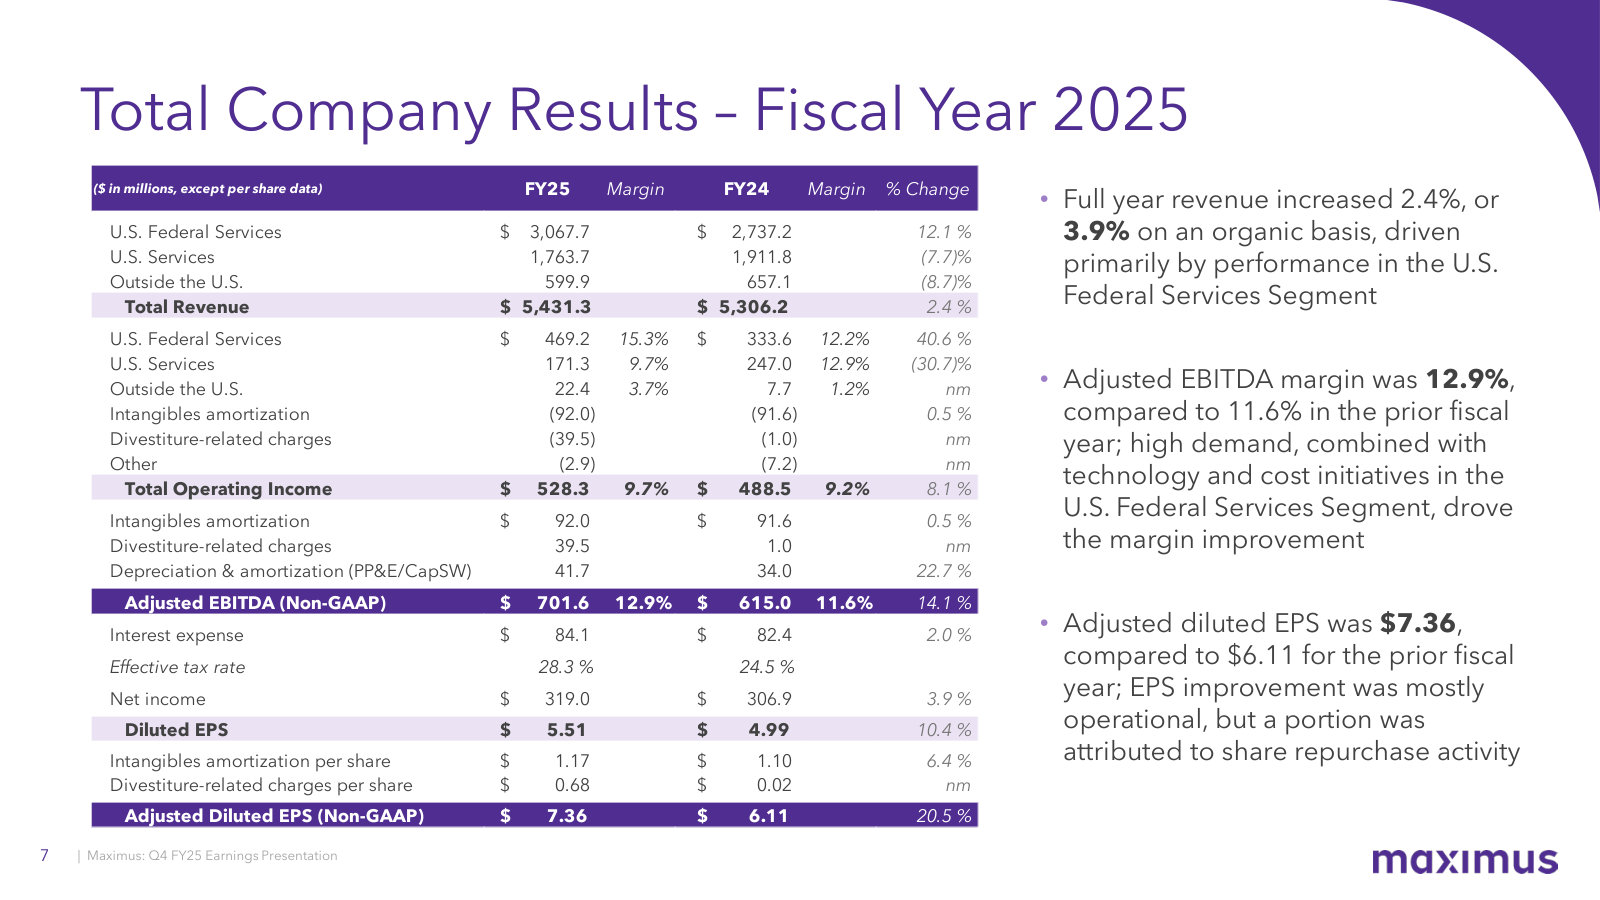
| U.S. Federal Services | 1,893,284 | 2,259,744 | 2,403,606 | 2,737,244 | 3,067,691 |
| U.S. Services | 1,662,110 | 1,607,612 | 1,812,069 | 1,911,813 | 1,763,691 |
| Outside the U.S. | 699,091 | 763,662 | 689,053 | 657,140 | 599,894 |
| Total revenue | 4,254,485 | 4,631,018 | 4,904,728 | 5,306,197 | 5,431,276 |
| Total revenue growth, derived | — | +8.9% | +5.9% | +8.2% | +2.4% |
Source: Note 3. Business Segments — Results of Operation by Business Segment (Table 3.1) [5] [6] [7] [8]. Click any linked figure to open the filing page with the row highlighted.
Segment Operating Income
| Segment Operating Income | FY2021 | FY2022 | FY2023 | FY2024 | FY2025 |
|---|---|---|---|---|---|
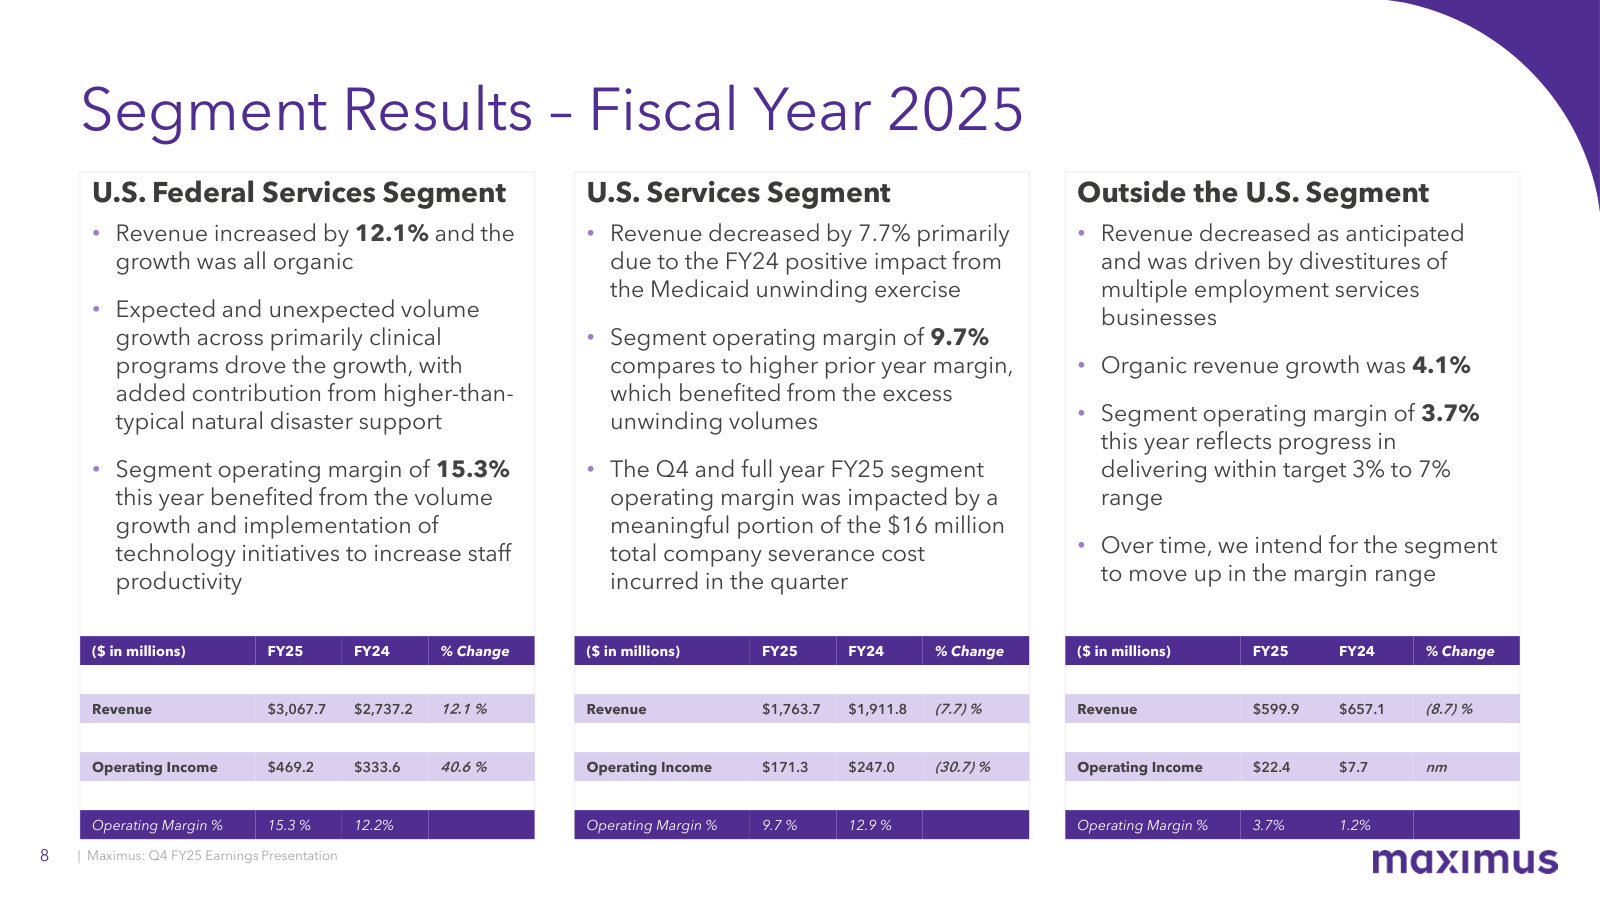
| U.S. Federal Services | 189,066 | 234,931 | 249,689 | 333,622 | 469,155 |
| U.S. Services | 254,441 | 182,102 | 182,550 | 246,982 | 171,264 |
| Outside the U.S. | 20,126 | (15,170) | (9,130) | 7,705 | 22,391 |
| Total segment operating income | 463,633 | 401,863 | 423,109 | 588,309 | 662,810 |
Source: Note 3. Business Segments — Results of Operation by Business Segment (Table 3.1) [5] [6] [7]. Click any linked figure to open the filing page with the row highlighted.
Income Statement
Source: Consolidated Statements of Operations [1] [2] [3] [4]. Click any linked figure to open the filing page with the row highlighted.
Columns marked E are consensus analyst estimates shown alongside reported results for direct comparison; they are not company guidance.
Estimate source: Yahoo Finance analyst consensus, as of 2026-07-19. Estimate figures link to the consensus source, not to filing pages.
Balance Sheet
Source: Consolidated Balance Sheets [9] [10] [11] [12]. Click any linked figure to open the filing page with the row highlighted.
Cash Flow
Source: Consolidated Statements of Cash Flows [13] [14] [15] [16]. Click any linked figure to open the filing page with the row highlighted.
Signed Contract Backlog
| Signed Contract Backlog | FY2021 | FY2022 | FY2023 | FY2024 | FY2025 |
|---|---|---|---|---|---|
| U.S. Federal Services backlog | 4,298,000 | 13,168,000 | 13,800,000 | 10,286,000 | 9,780,000 |
| U.S. Services backlog | 4,865,000 | 5,205,000 | 4,851,000 | 3,867,000 | 3,916,000 |
| Outside the U.S. backlog | 2,052,000 | 1,441,000 | 2,089,000 | 2,014,000 | 1,631,000 |
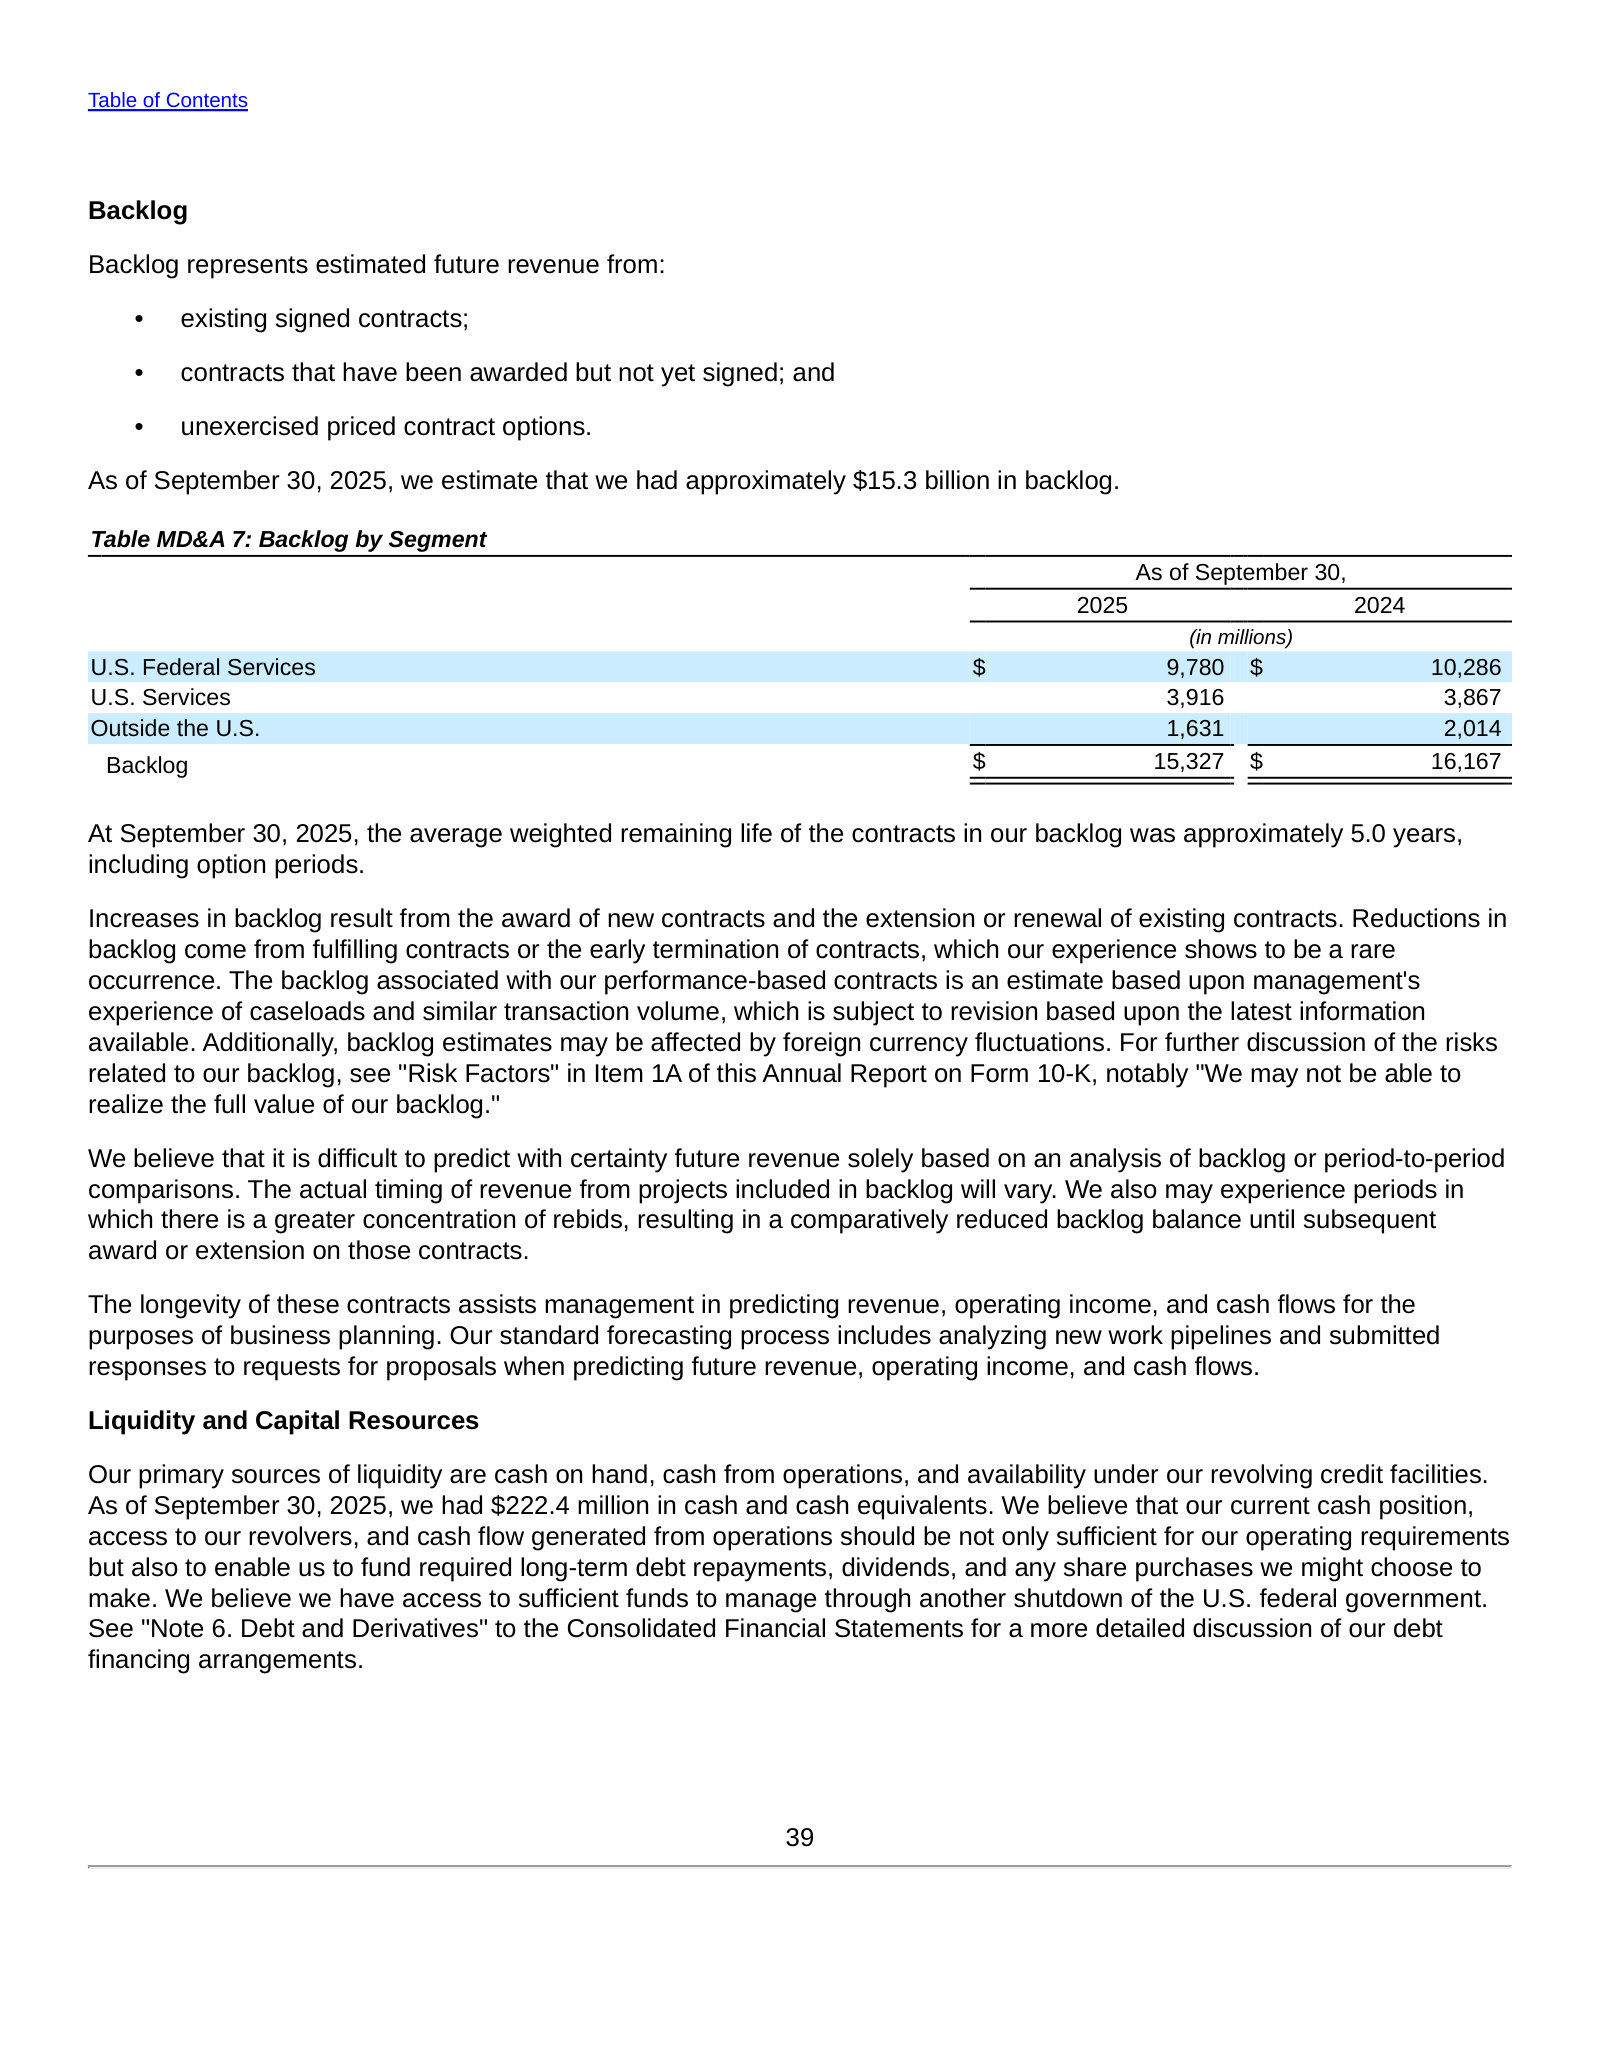
| Total backlog | 11,215,000 | 19,814,000 | 20,740,000 | 16,167,000 | 15,327,000 |
| Weighted-avg remaining contract life (years) | 4.4 | 6.8 | 5.9 | 6.3 | 5.0 |
Source: company filings [17] [18] [19] [20]. Click any linked figure to open the filing page with the row highlighted.
Non-GAAP Profitability Cash Generation
| Non-GAAP Profitability Cash Generation | FY2021 | FY2022 | FY2023 | FY2024 | FY2025 |
|---|---|---|---|---|---|
| Adjusted EBITDA | — | — | 447,861 | 615,044 | 701,554 |
| Adjusted EBITDA margin | — | — | 9.1% | 11.6% | 12.9% |
| Adjusted net income | 323,952 | 270,614 | 235,257 | 375,413 | 426,422 |
| Adjusted diluted EPS | 5.19 | 4.37 | 3.83 | 6.11 | 7.36 |
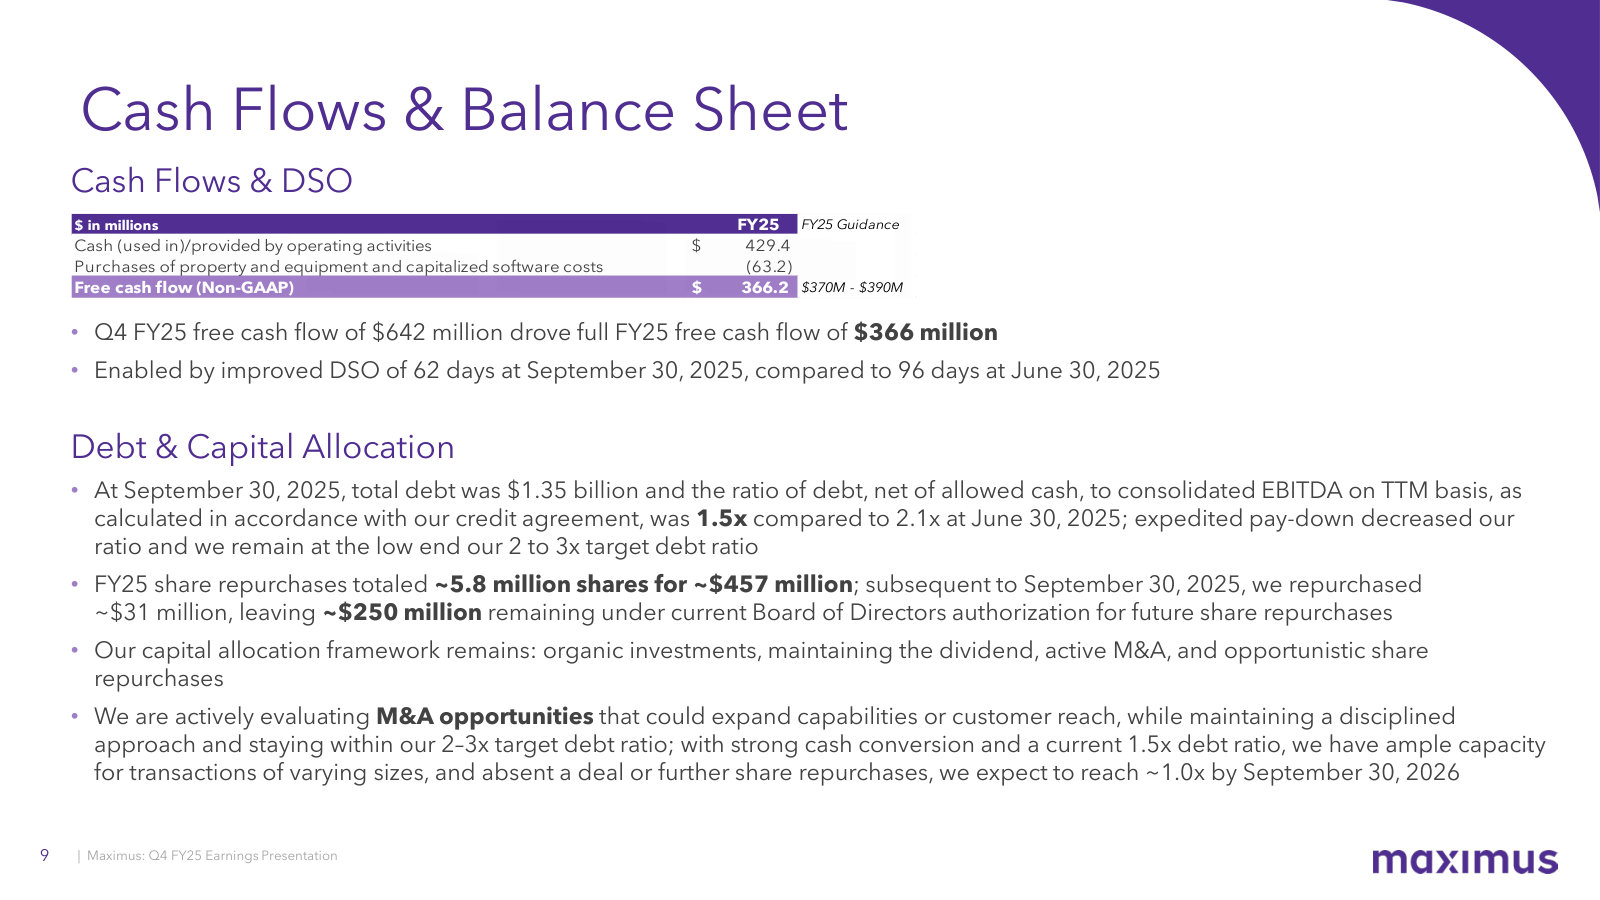
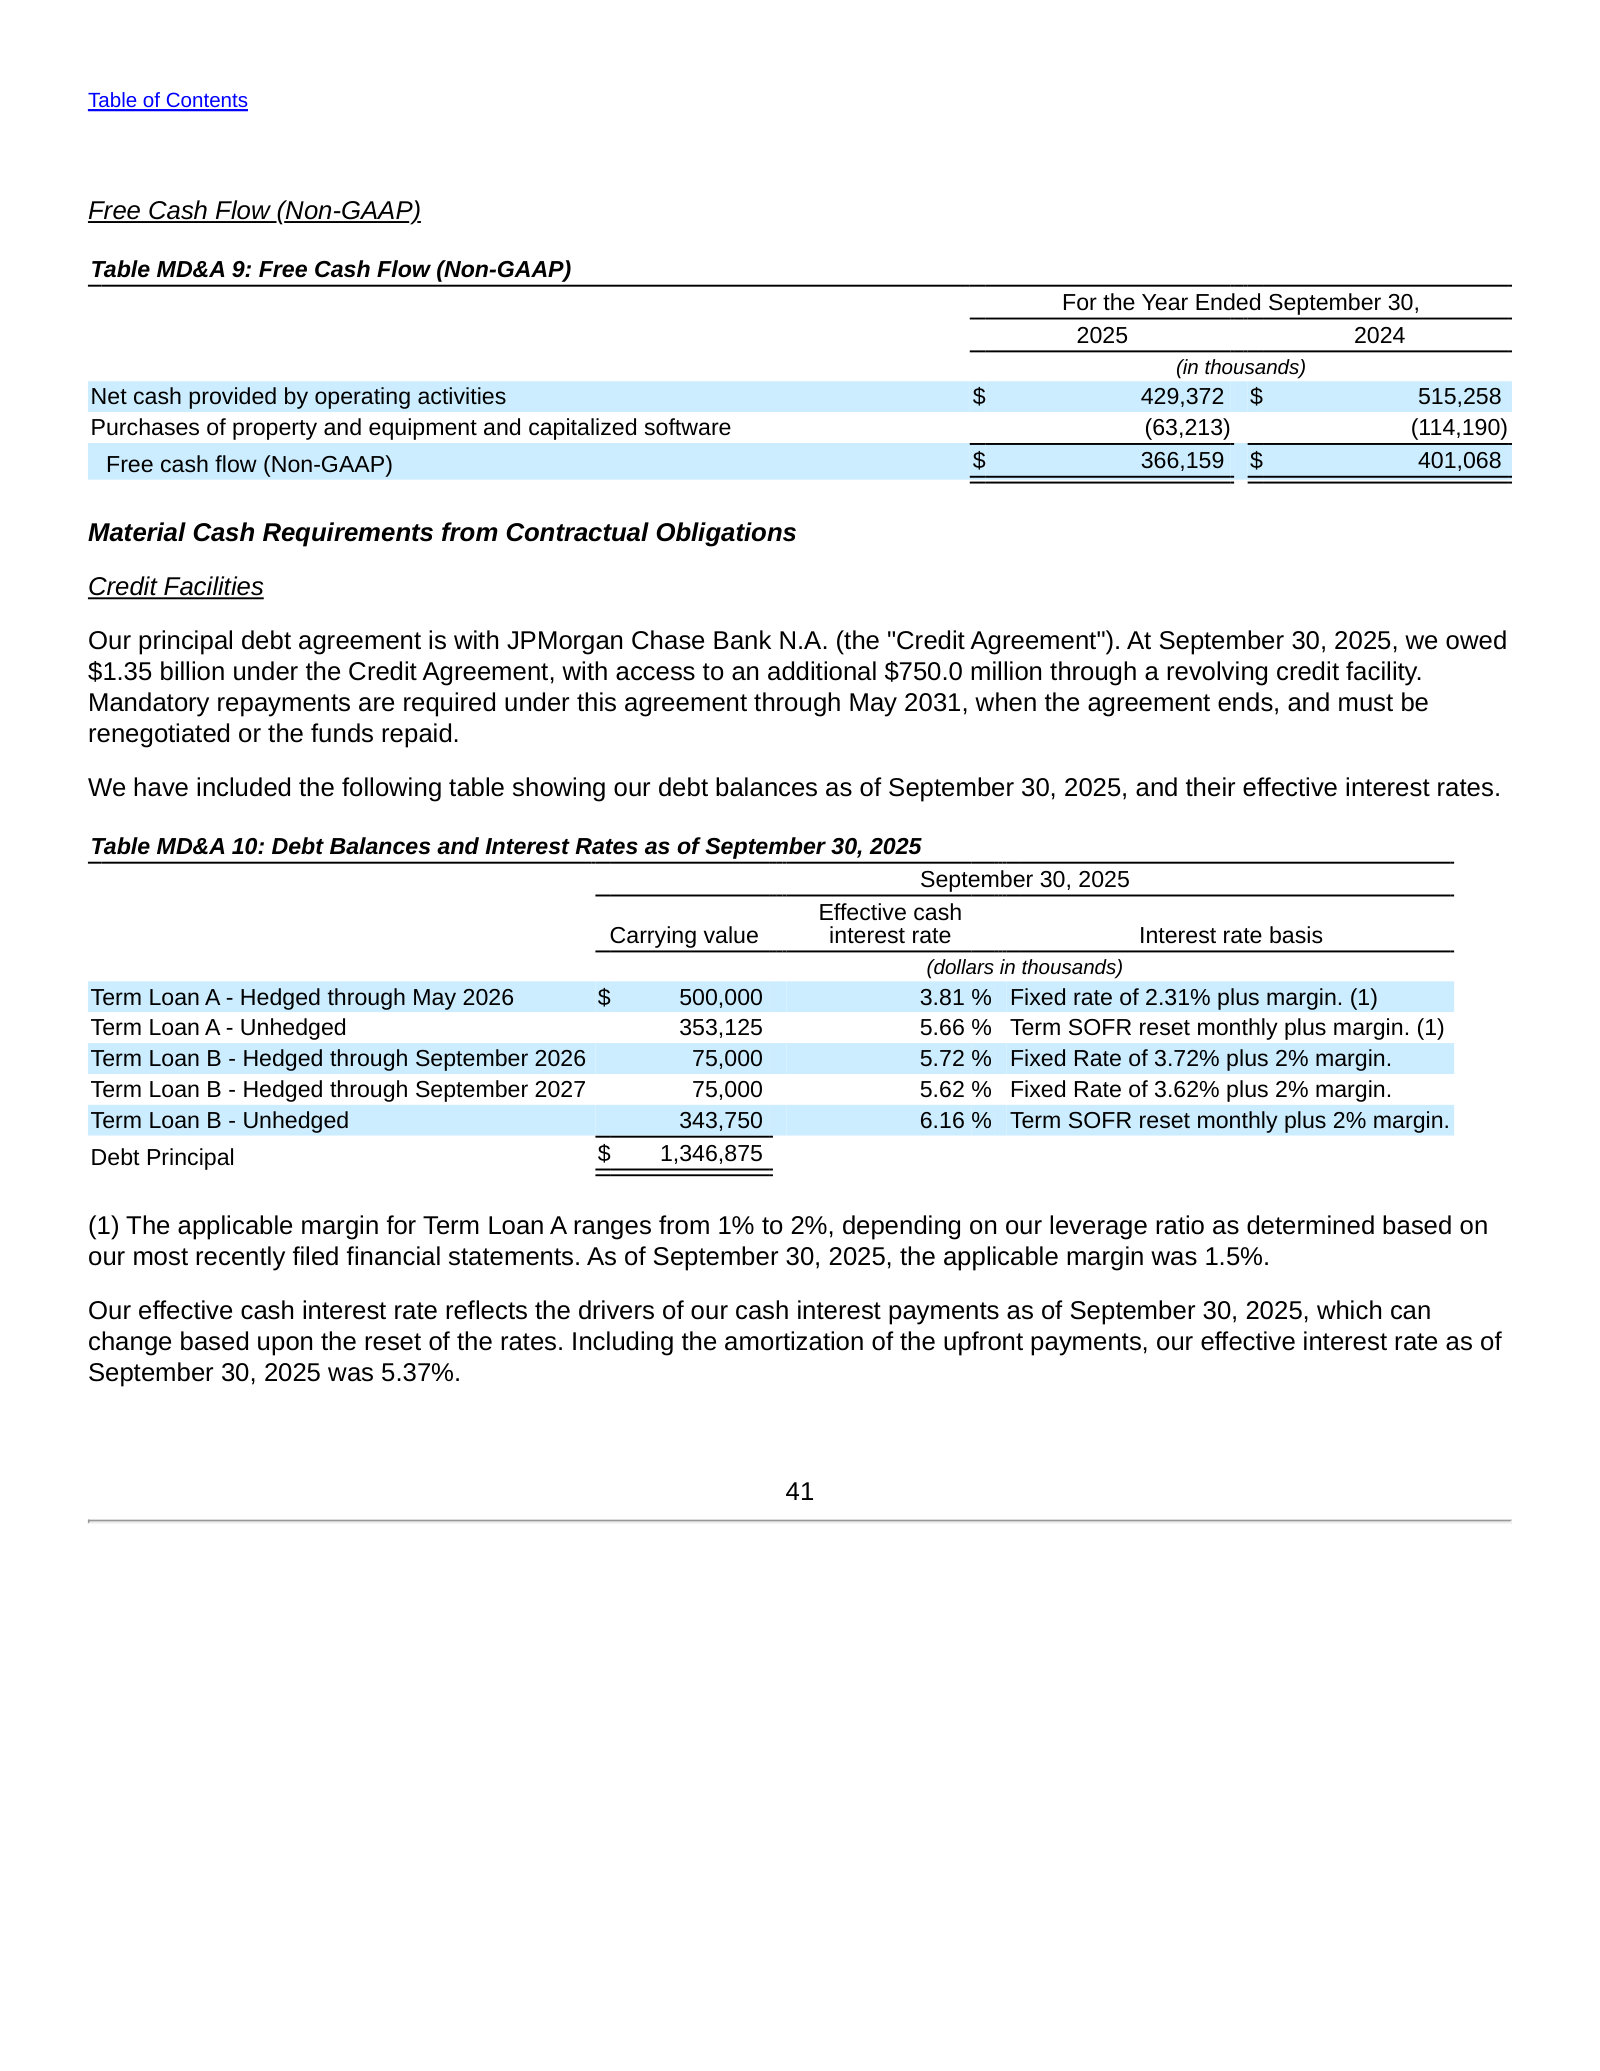
| Free cash flow (Non-GAAP) | 480,757 | 233,694 | 223,645 | 401,068 | 366,159 |
Source: company filings [21] [22] [23] [24]. Click any linked figure to open the filing page with the row highlighted.
Contract Mix Workforce
| Contract Mix Workforce | FY2021 | FY2022 | FY2023 | FY2024 | FY2025 |
|---|---|---|---|---|---|
| Performance-based contracts (% of revenue) | 33.0% | 45.0% | 49.0% | 55.0% | 54.0% |
| Fixed-price contracts (% of revenue) | 13.0% | 14.0% | 15.0% | 13.0% | 13.0% |
| Days sales outstanding (days) | 68 | 62 | 60 | 61 | 62 |
| Employees | 35,800 | 39,500 | 39,600 | 41,100 | 37,200 |
| Contingent workers | 14,000 | 12,550 | 12,400 | 11,800 | 9,300 |
Source: company filings [25] [26] [27] [28]. Click any linked figure to open the filing page with the row highlighted.
Long-Term Record
| Fiscal year | Total revenue | Operating income | Net income | Diluted EPS | Operating cash flow |
|---|---|---|---|---|---|
| FY2016 | — | 286,603 | 178,362 | 2.69 | 180,026 |
| FY2017 | 2,450,961 | 313,512 | 209,426 | 3.17 | 336,424 |
| FY2018 | 2,392,236 | 295,483 | 220,751 | 3.35 | 316,774 |
| FY2019 | 2,886,815 | 317,107 | 240,824 | 3.72 | 356,727 |
| FY2020 | 3,461,537 | 288,278 | 214,509 | 3.39 | 244,592 |
| FY2021 | 4,254,485 | 408,530 | 291,200 | 4.67 | 517,322 |
| FY2022 | 4,631,018 | 325,898 | 203,828 | 3.29 | 289,839 |
| FY2023 | 4,904,728 | 294,794 | 161,792 | 2.63 | 314,340 |
| FY2024 | 5,306,197 | 488,499 | 306,914 | 4.99 | 515,258 |
| FY2025 | 5,431,276 | 528,289 | 319,034 | 5.51 | 429,372 |
Source: consolidated statements across filings; older years from the standardized feed [13] [1] [14] [2]. Click any linked figure to open the filing page with the row highlighted.
Operating KPIs
| KPI | FY2021 | FY2022 | FY2023 | FY2024 | FY2025 |
|---|---|---|---|---|---|
| Total backlog | 11,200,000 | 19,800,000 | 20,700,000 | 16,200,000 | 15,300,000 |
Source: company-reported operating metrics [17] [18] [19] [20]. Click any linked figure to open the filing page with the row highlighted.
Analyst Consensus
Current price
Mean target
Median target
High target
Low target
Estimate source: Yahoo Finance analyst consensus, as of 2026-07-19. Estimate figures link to the consensus source, not to filing pages.
Traceability
363 of 381 figures on this page (95%) link to the filing page where they are printed — click a linked figure to open the source PDF at that page with the row highlighted. Unlinked figures come from standardized data feeds or pre-filing years.
All figures are in thousands of US dollars exactly as printed in the 10-K statements (units line: 'in thousands, except per share amounts'), except per-share and backlog rows.
Each fiscal year FY2021-FY2025 is cited to its own Form 10-K (Consolidated Statements of Operations / Balance Sheets / Cash Flows and the Note 3 Business Segments table). FY2022 revenue and segment-profit cells are cited to the FY2023 10-K's comparative column (Note 3 table on p.81).
Long-term record: FY2019 and FY2020 are cited to comparative columns of the FY2021 Form 10-K; FY2016-FY2018 are from the standardized data feed (SEC XBRL) and shown without page links (no filing in the corpus).
Segment operating income: FY2025 is the single 'Segment operating income' line printed in the new ASU 2023-07 segment table (p.84). FY2021-FY2024 use the per-segment 'Operating income/(loss)' rows; the total segment operating income for those years is the sum of the three segments (components cited, total computed).
Income-statement presentation: 'Other (income)/expense, net' is omitted for brevity; in the FY2021 10-K interest expense is printed as a deduction '(14,744)' whereas FY2022+ print it as a positive expense — values are stored as positive magnitudes and the anchor is the printed form.
Cash-flow outflows (capex, dividends, buybacks, acquisitions) are stored as negative values matching the printed parenthesized figures; net financing was a cash inflow in FY2021 (debt-funded VES/Aidvantage acquisitions).
Total backlog is management's approximate estimate of future revenue from the existing contract portfolio at each September 30 fiscal year end.
1 figure(s) differed between the data feed and the filing; the filing value is shown (see the run's metrics/metrics_tab.json for the audit trail).
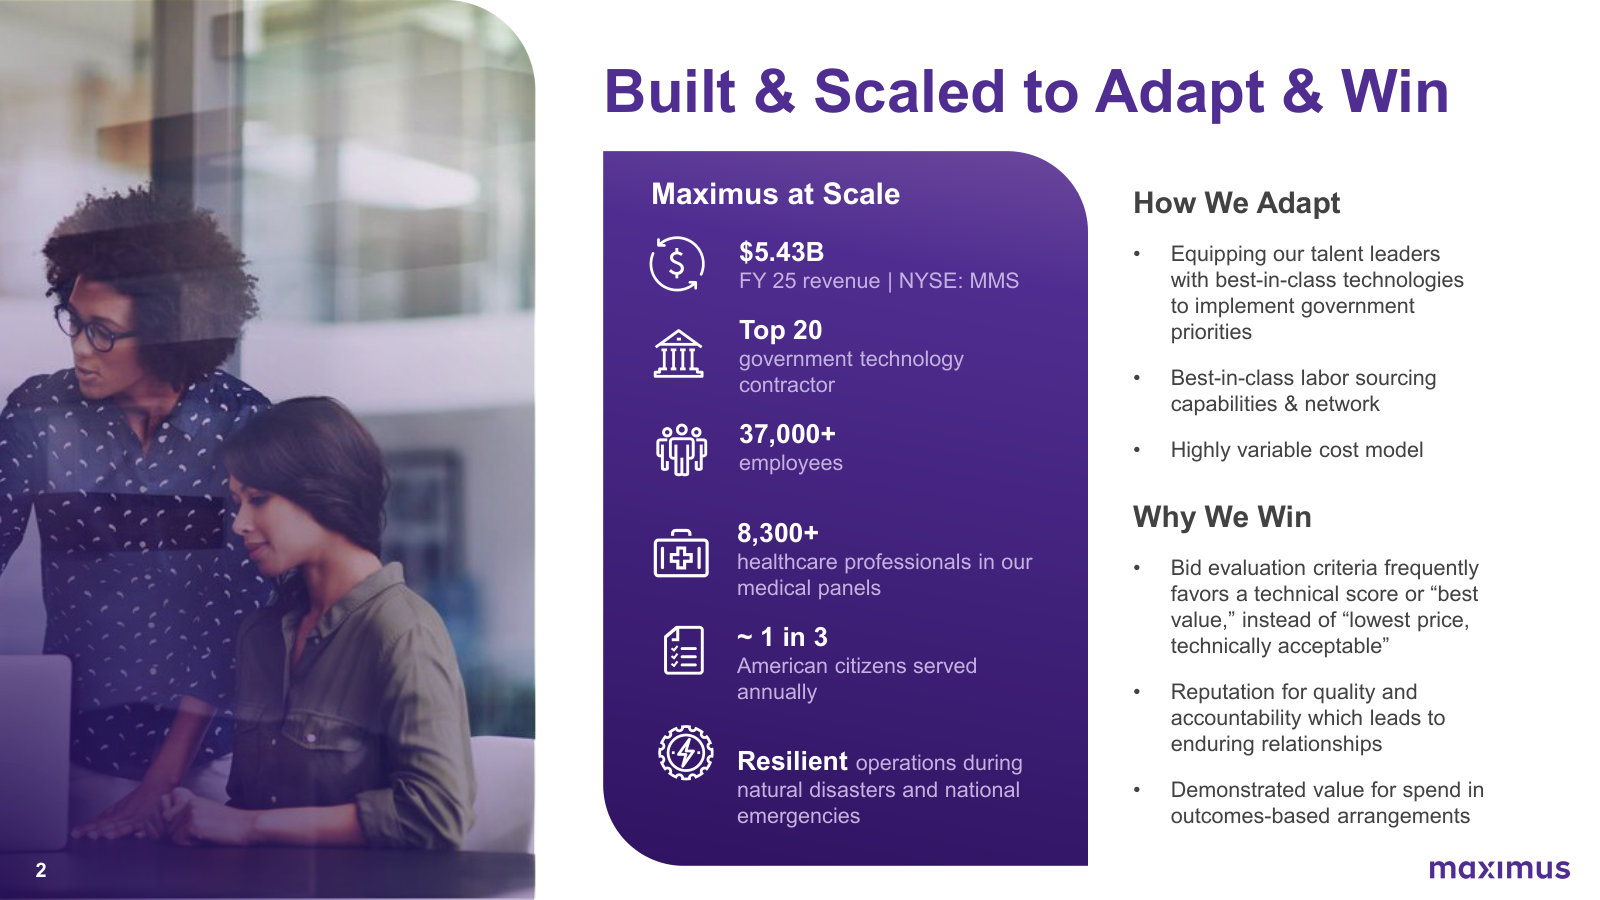
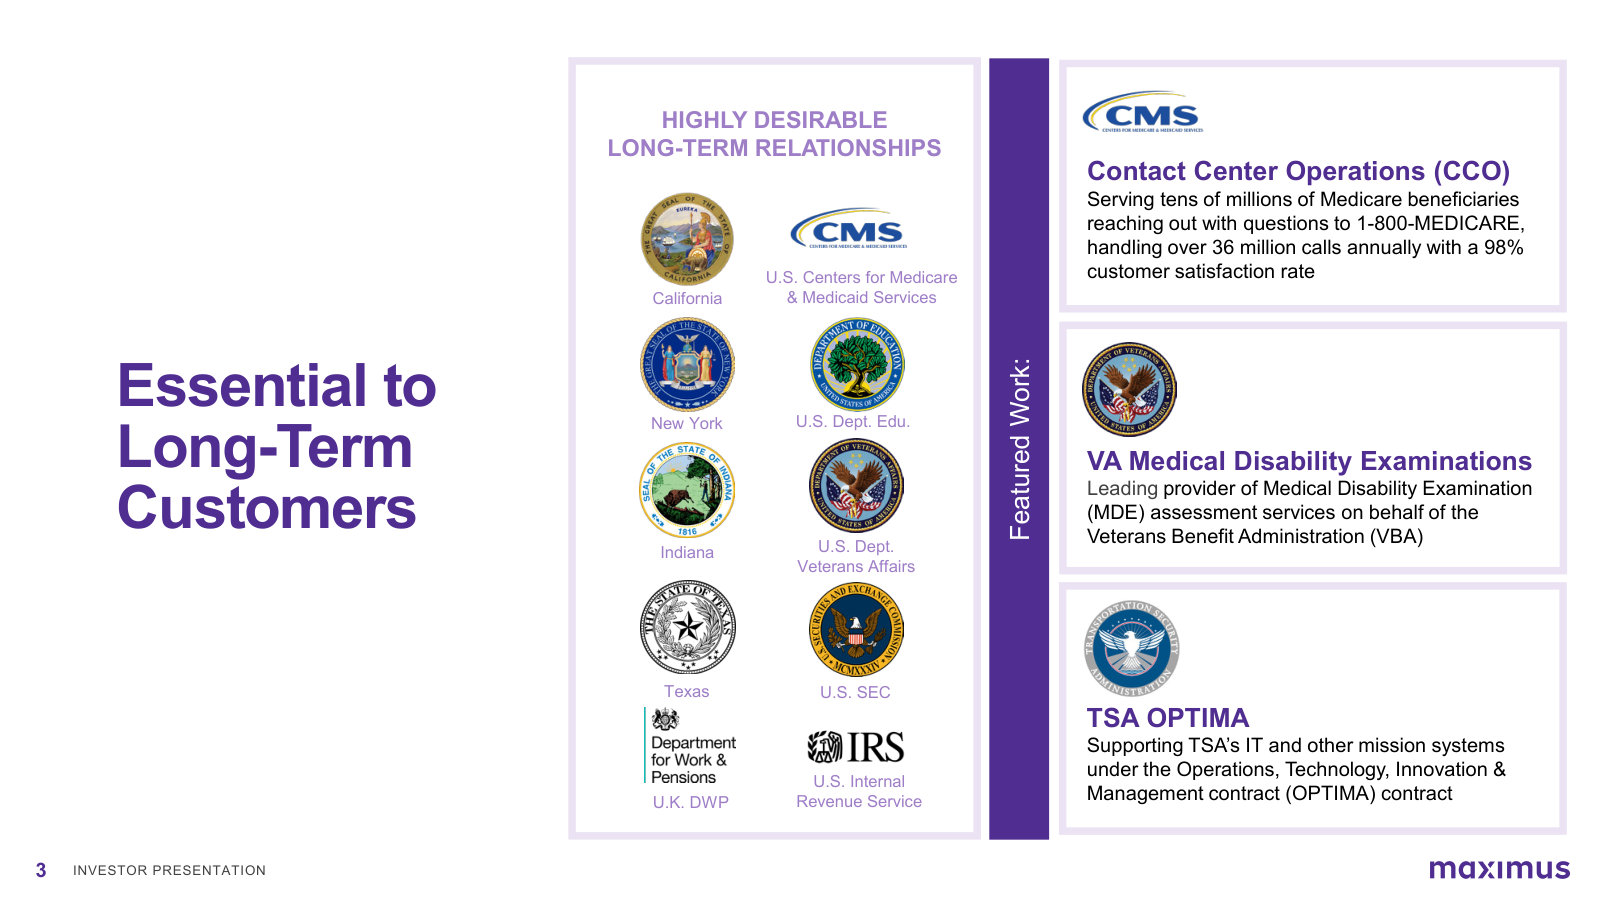
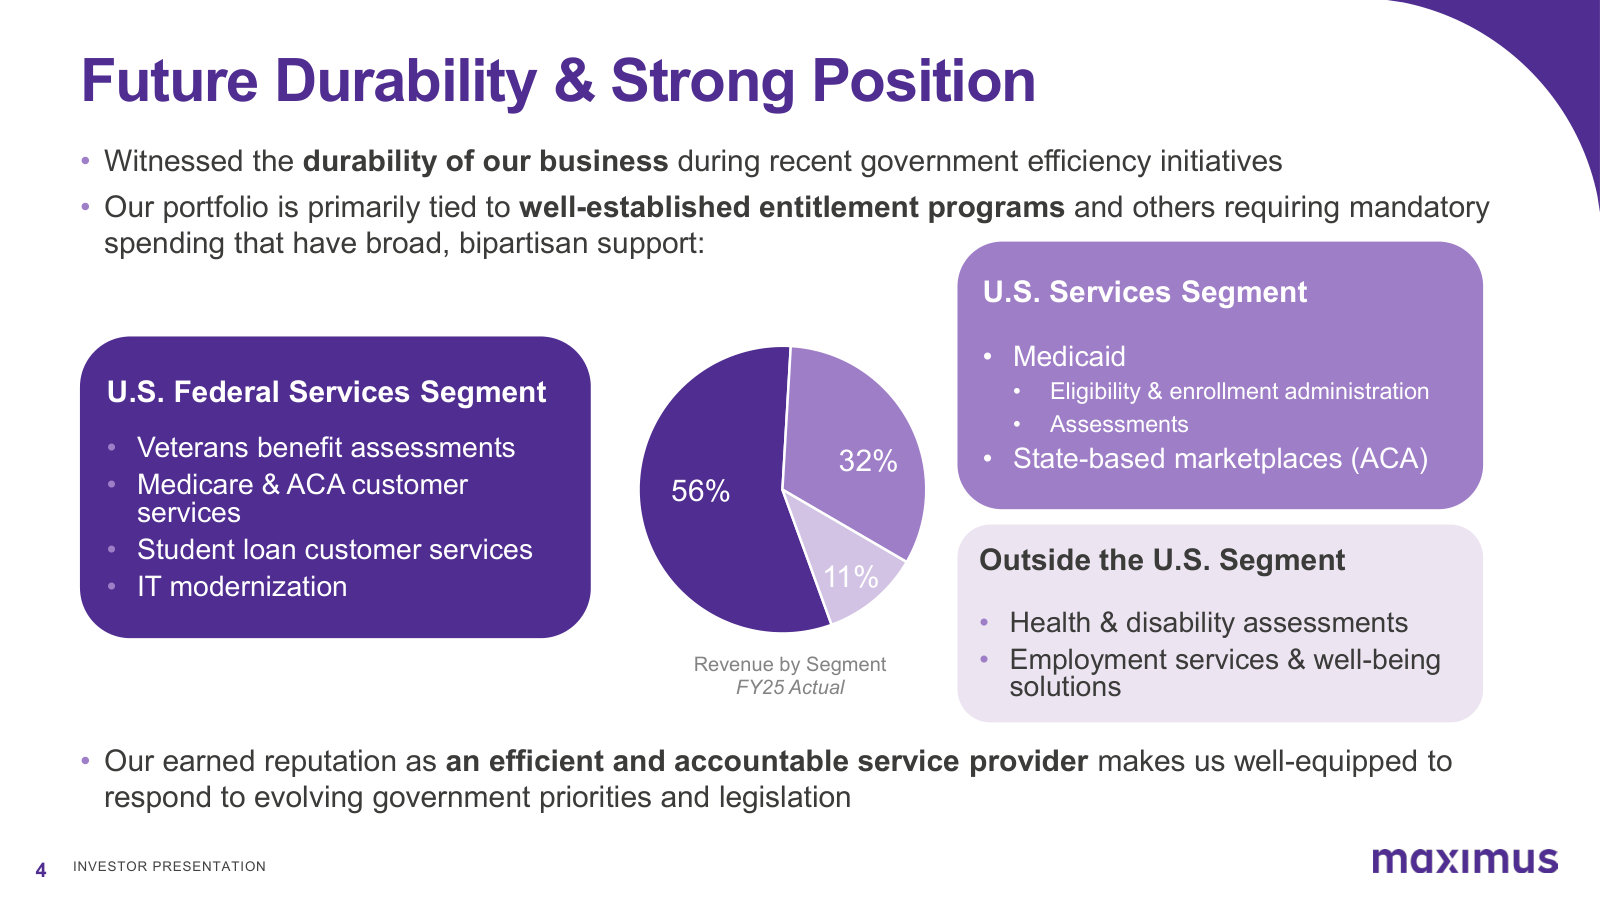
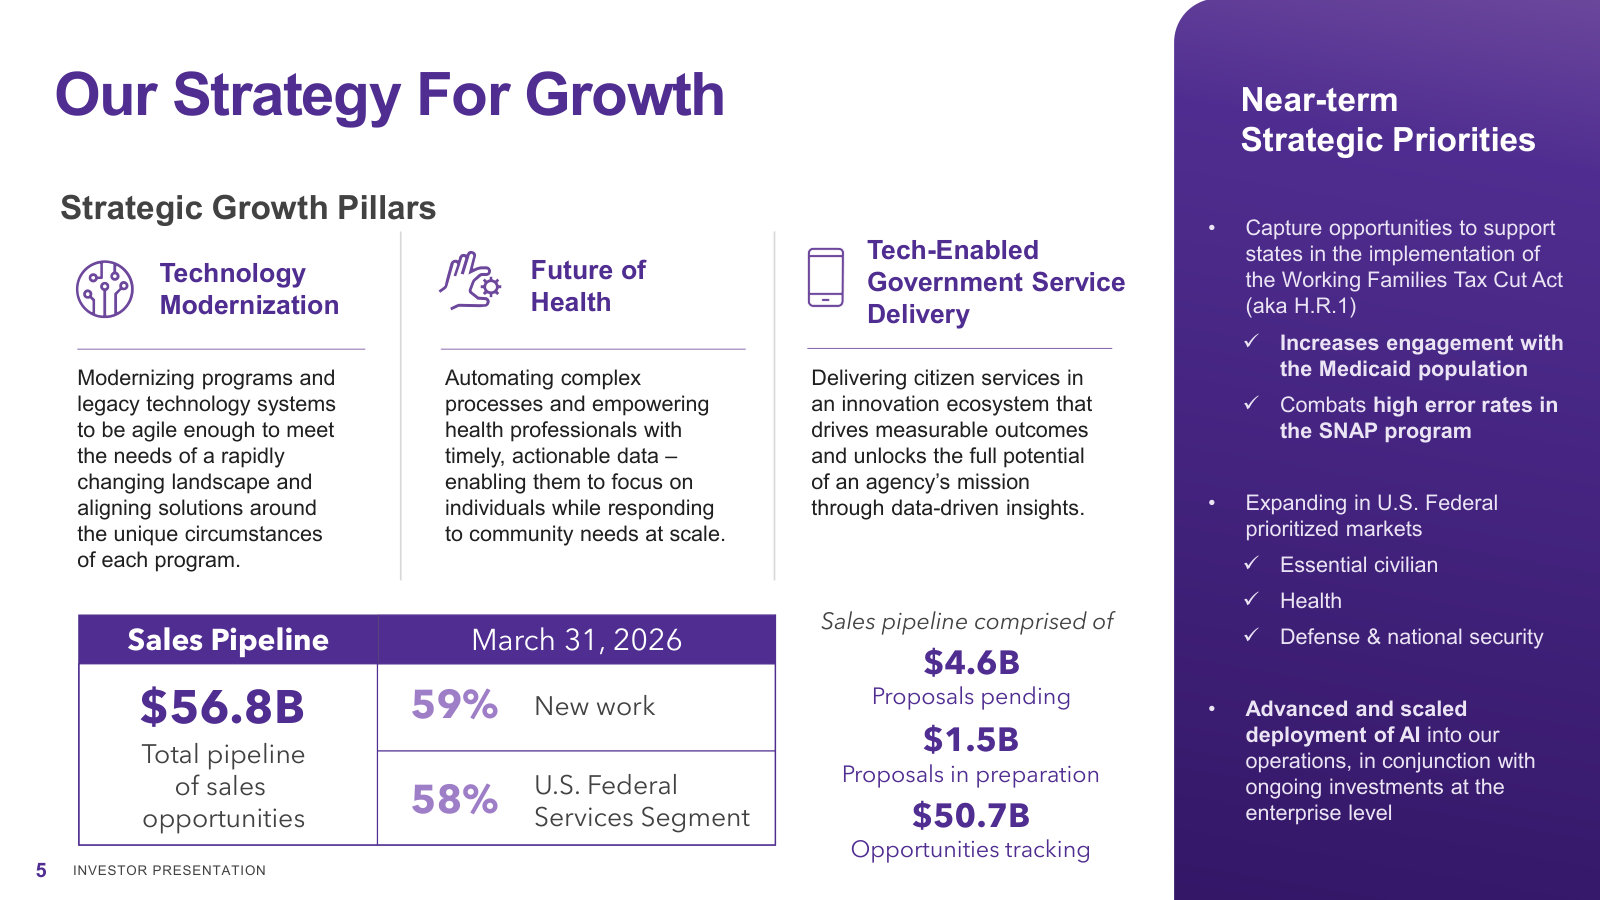
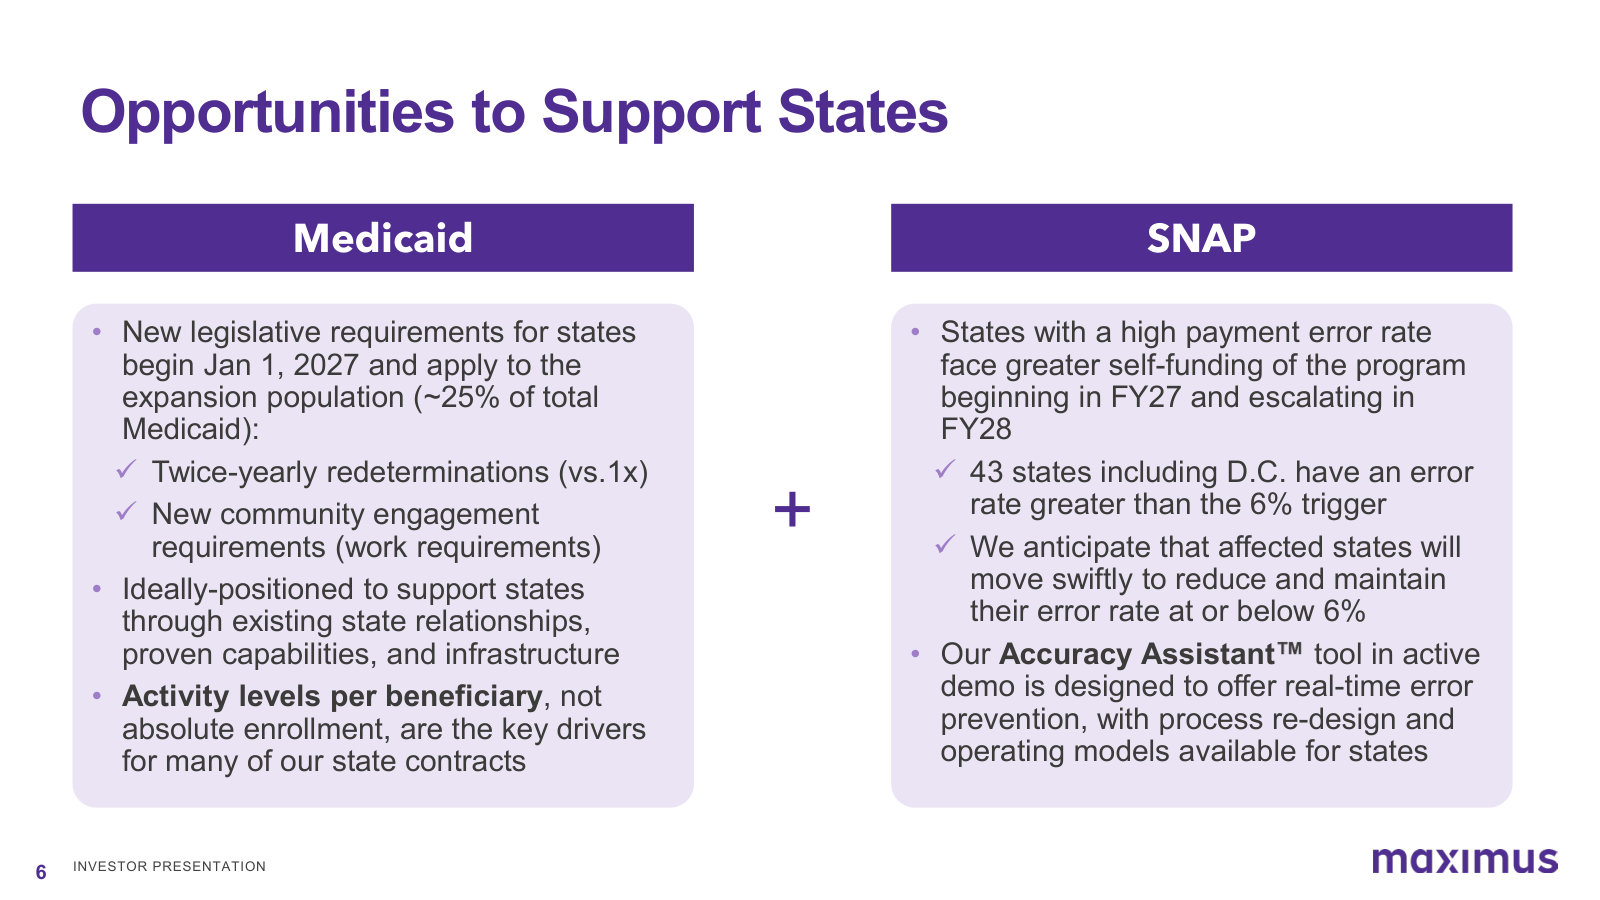
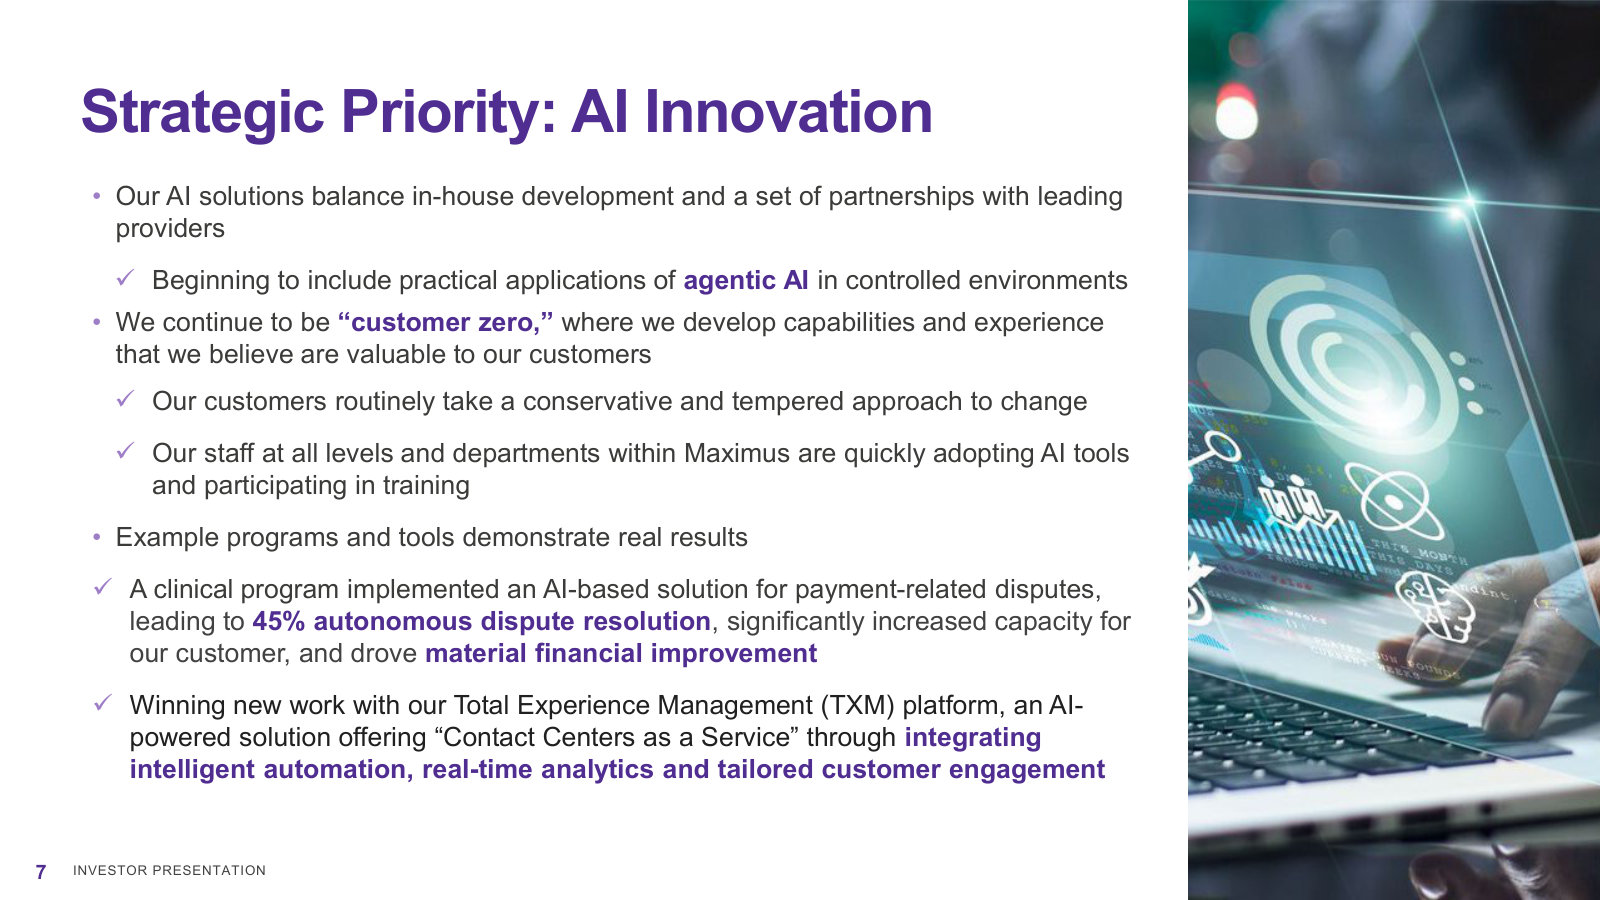
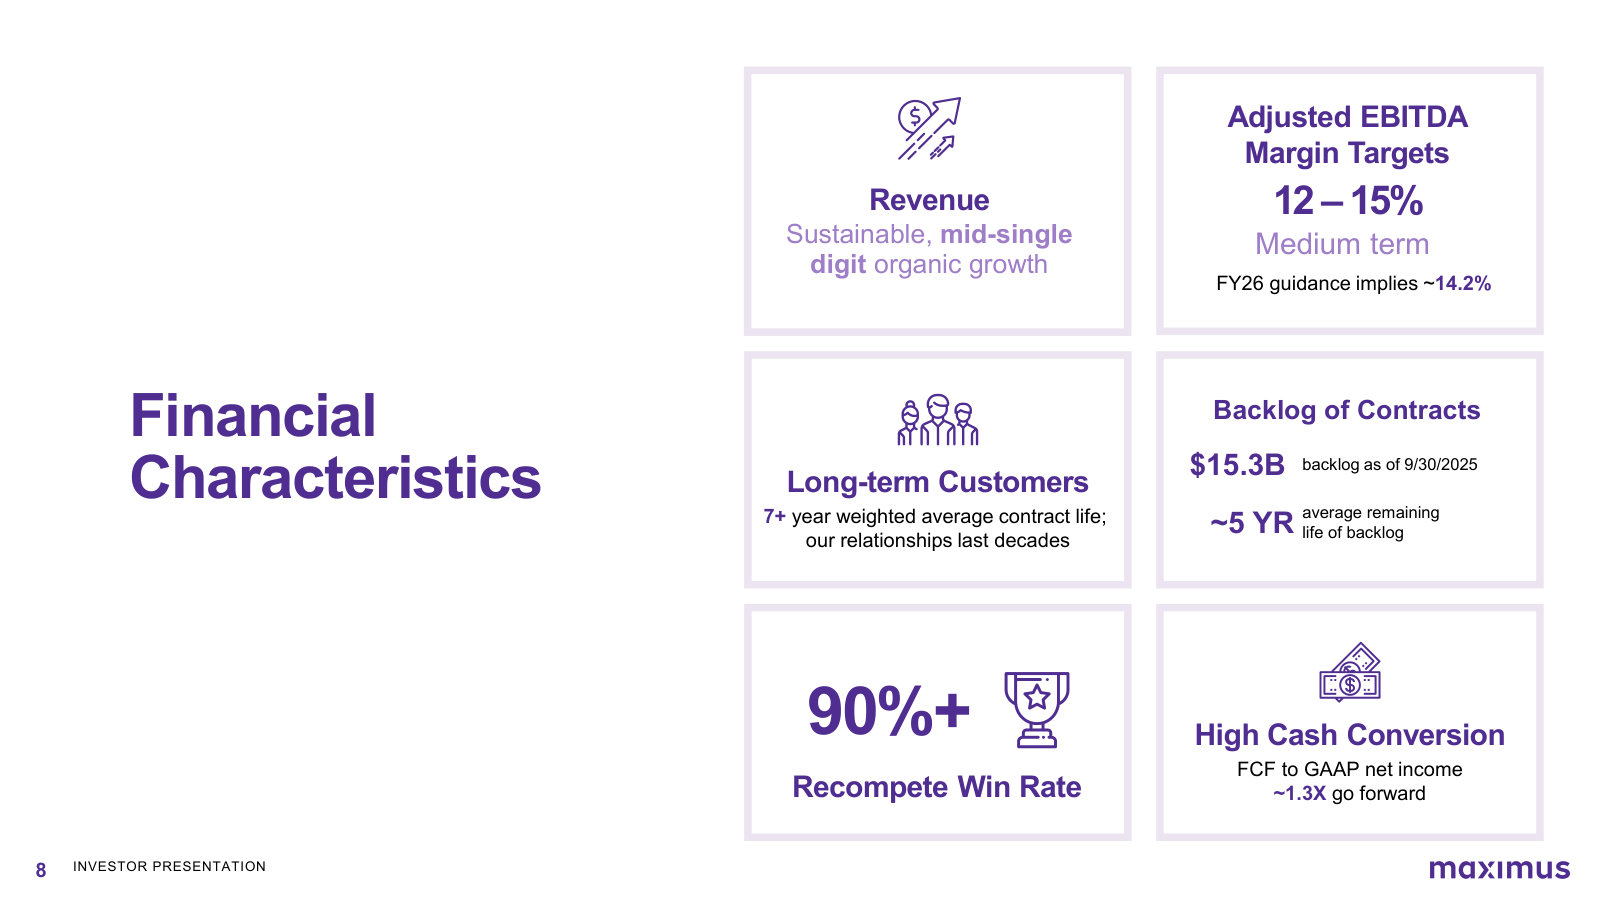
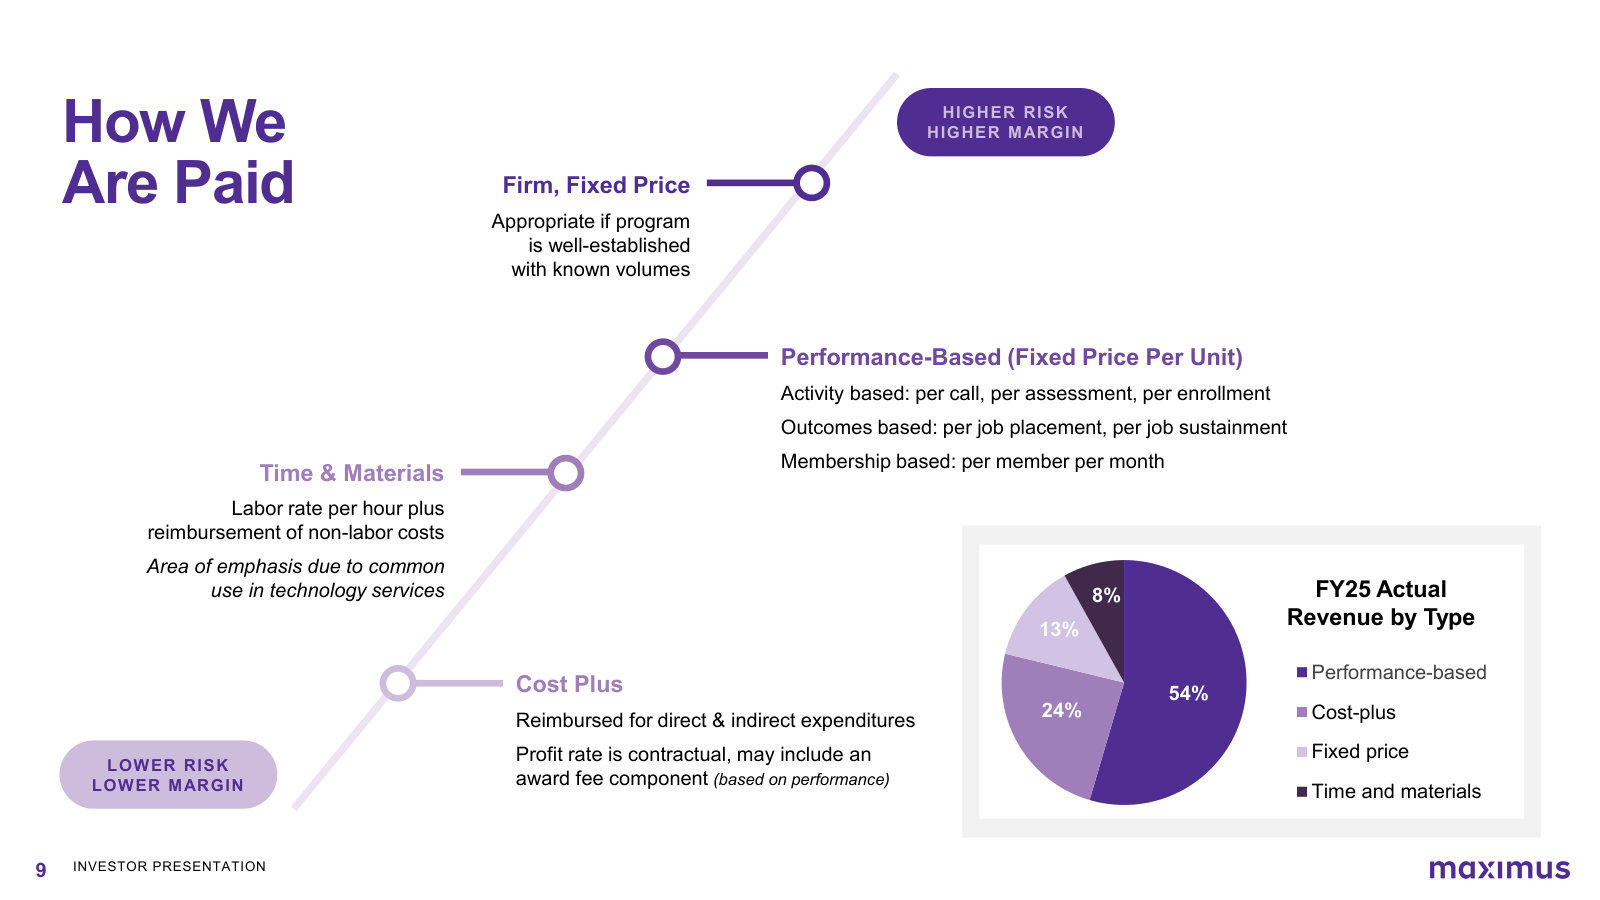
Maximus, Inc.'s management explains the business in its own materials. The slides below do the most of that work, pulled from the documents preserved in Sources. Each source link opens the complete presentation at that slide in a new tab.
Investor Presentation — June 2026
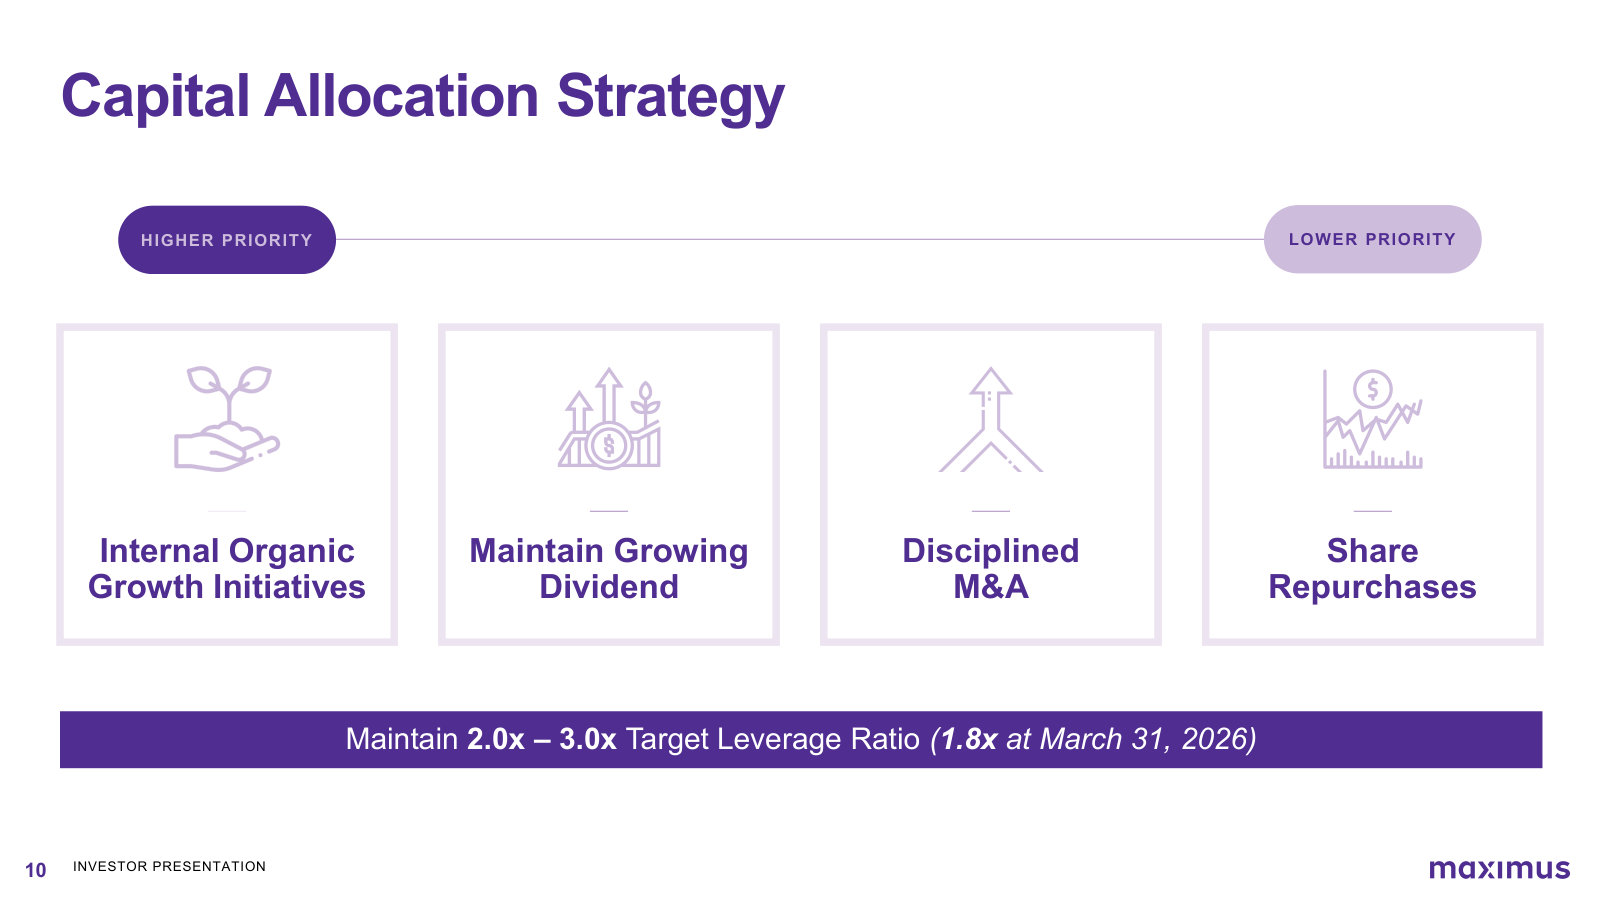
Management's fullest current overview of the business — what it does, who it serves, how it gets paid, and its economic model — in one deck. · Open the full document →
Fiscal 2025 Year End Earnings Call — FY2025
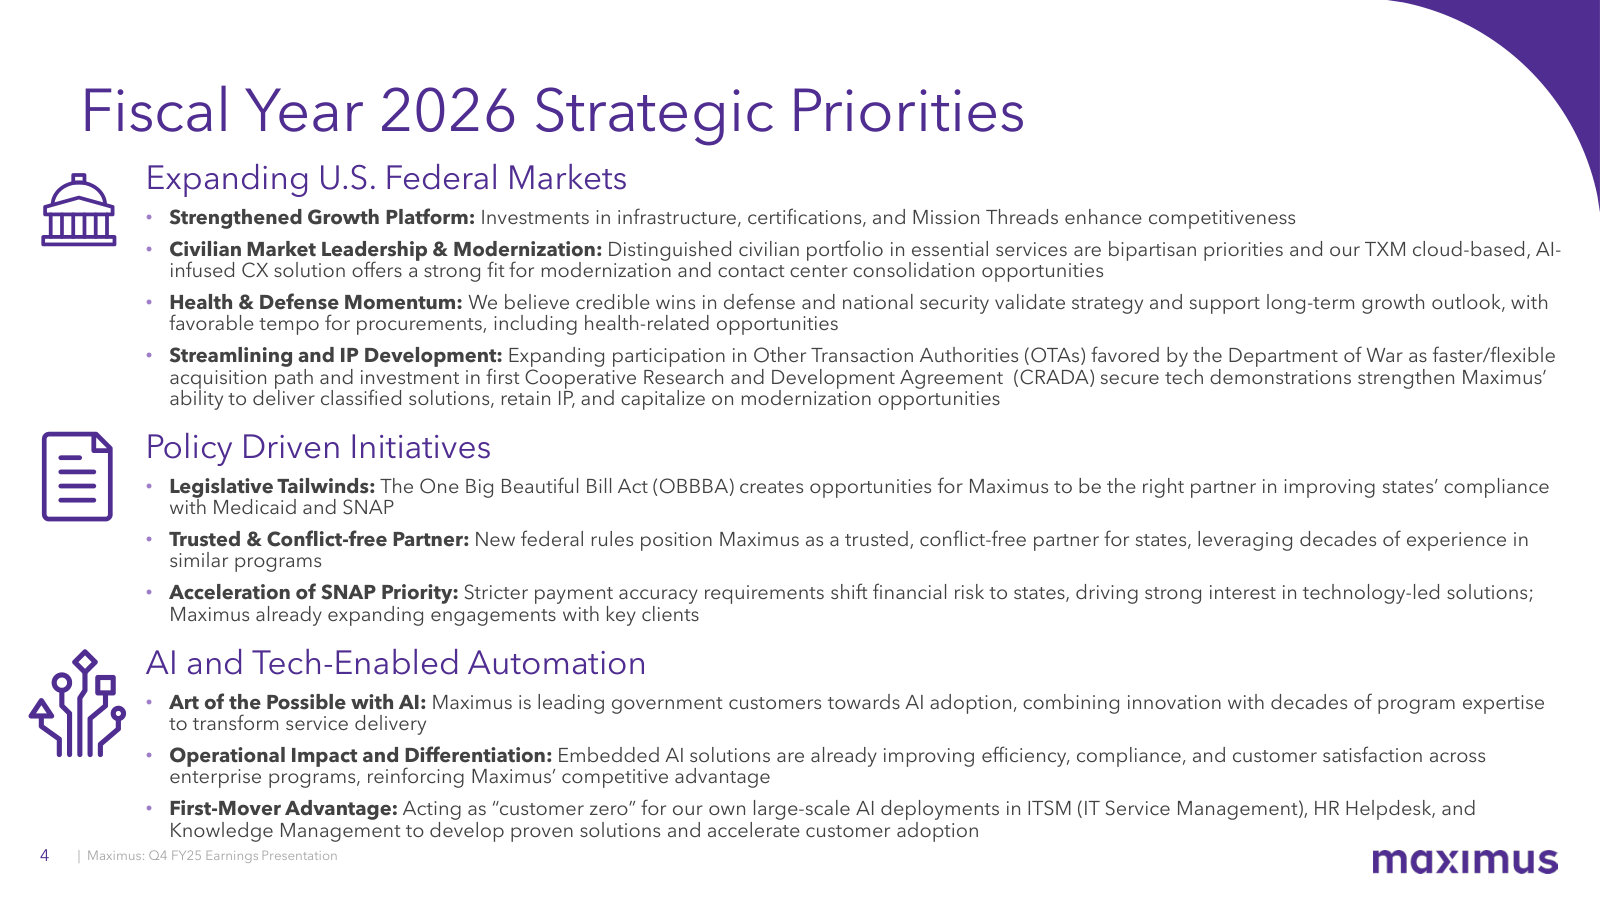
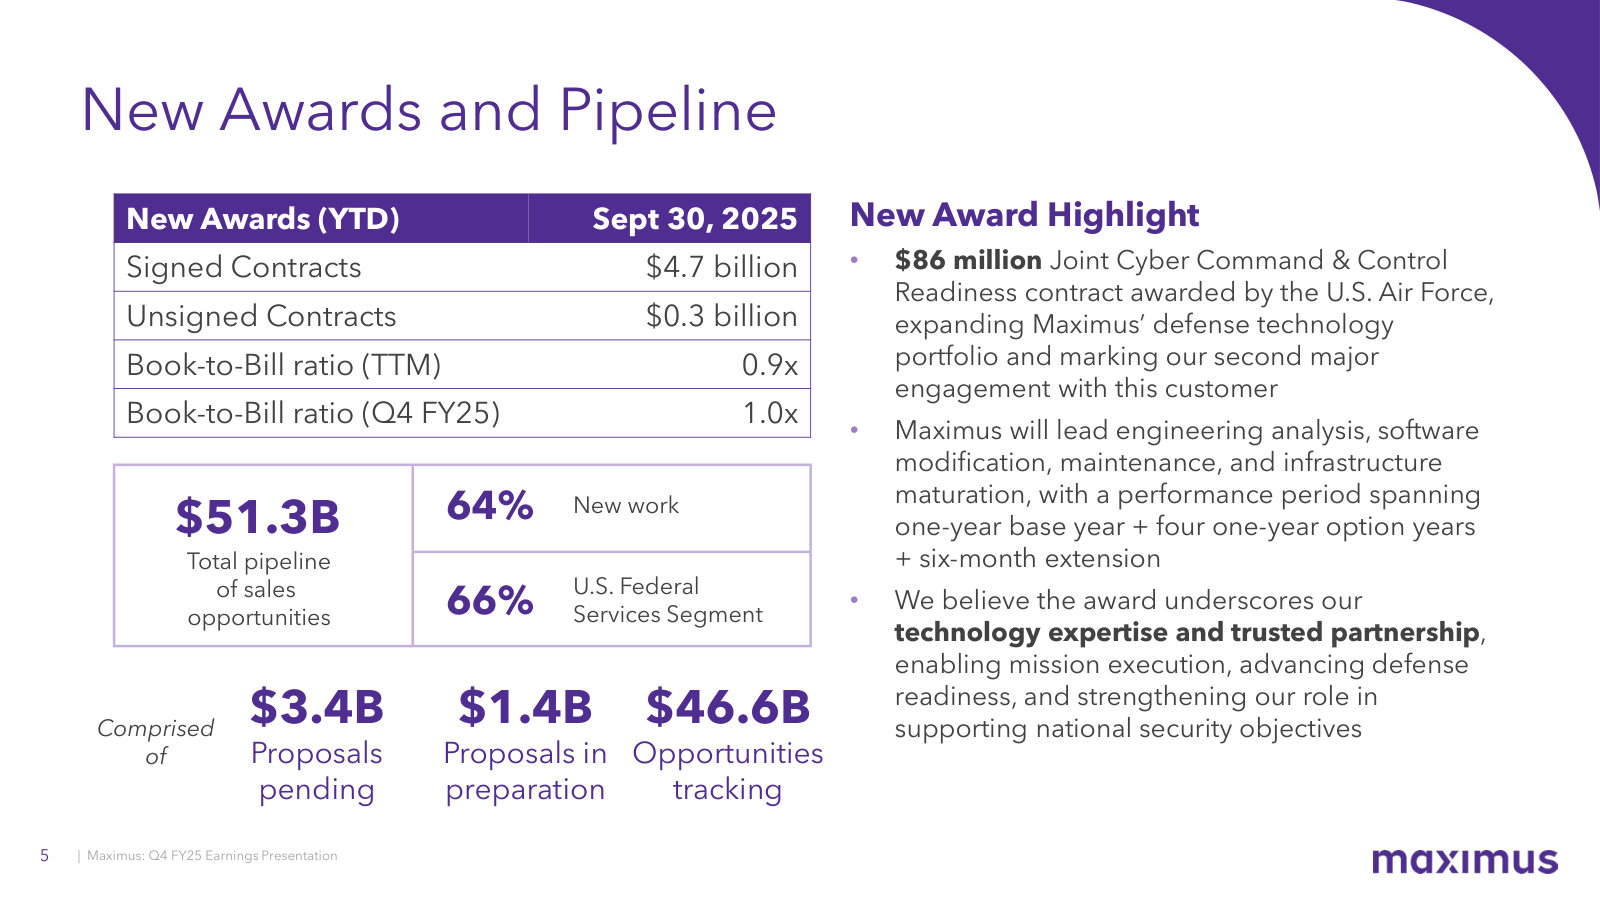
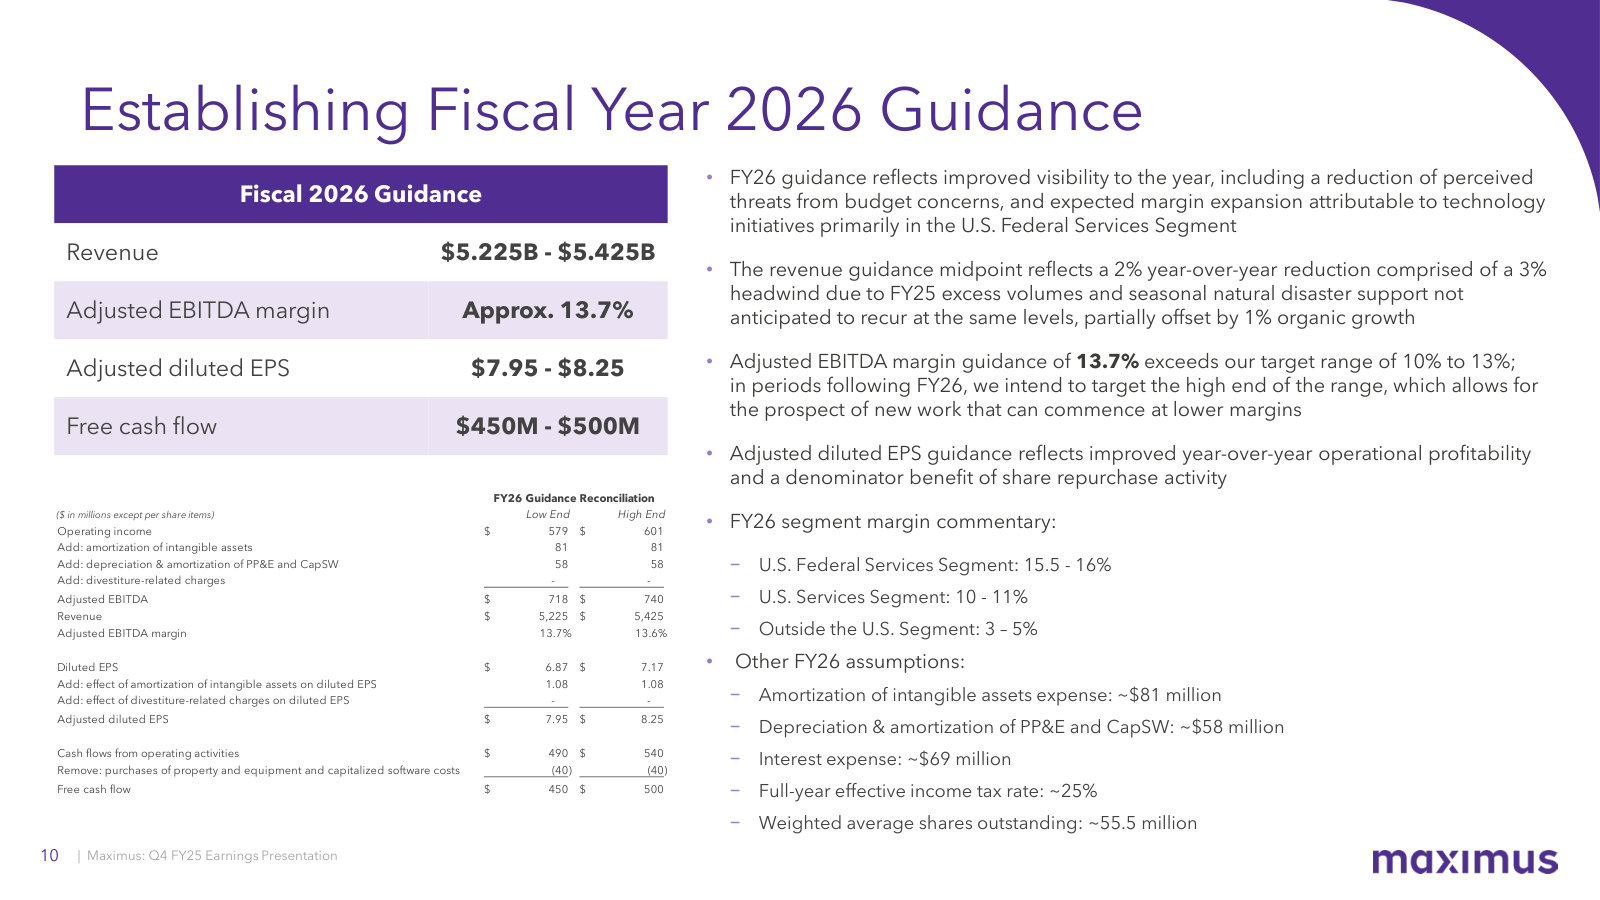
The annual capstone deck: the actual segment P&L, cash flow and balance sheet behind the overview, plus FY2026 targets. · Open the full document →
More from management
Fiscal 2026 Second Quarter Earnings Call — Q2 FY2026 · 11 pages · The latest quarterly deck, with unique slides on technology-enabled program-integrity/fraud work and the maximus|TxM AI platform. · Open →
Fiscal 2024 Year End Earnings Call — FY2024 · 16 pages · The prior full-year deck — the FY2024 segment baseline the FY2025 numbers are measured against. · Open →
Fiscal 2023 Year End Earnings Call — FY2023 · 17 pages · An earlier year-end deck for the multi-year trajectory of segments, margins and cash flow. · Open →
Maximus, Inc.'s management answers for the business every quarter. These are the exchanges that explain it best — verbatim, from the call transcripts preserved in Sources. Each link opens the full transcript at that page in a new tab.
Q2 FY2026 Earnings Call — May 7, 2026
The clearest read on the current margin thesis — technology that decouples labor from volume — plus why those AI gains land in Federal and not state work, how the new H.R. 1 Medicaid/SNAP revenue is actually earned, and a candid look at elevated federal receivables. · Open the full transcript →
The core margin engine: technology embedded in programs decouples labor cost from volume, lifting Federal segment margin to 17.6%.
David Mutryn, Chief Financial Officer: The operating income margin for this segment in the second quarter was 17.6% as compared to 15.3% in the prior-year period. […] This quarter’s segment margin is delivering on that commitment thanks to technology initiatives embedded in our programs that decouple labor costs from our ability to process more volumes.
p. 2 · Read in context →
Capital-allocation discipline: buy back stock only below intrinsic value, within a 2x–3x leverage band, while still pursuing M&A.
David Mutryn, Chief Financial Officer: We have long said that we are opportunistic in our share repurchasing. To be more direct, we prioritize repurchasing when we believe our share price does not reflect the intrinsic value of the business based on a disciplined and conservative assessment. Going forward, we will continue to execute on our capital deployment priorities while considering near-term liquidity, the potential M&A opportunity set, and all within the constraint of our stated target net debt ratio of 2x to 3x. Even amidst market conditions that are favorable to share repurchases, we continue to seek acquisition targets to accelerate longer-term organic growth.
p. 2 · Read in context →
How H.R. 1 revenue is earned: a tool surfaces eligibility inconsistencies; wrapped BPO services contact beneficiaries to fix them.
Bruce Caswell, President and CEO: At the heart, it is really that tool and then the services we can wrap around it to help states identify instances where there could be inconsistencies. The tool surfaces inconsistencies in the data, and then the BPO services are used to contact beneficiaries, obtain corrections, and ensure an accurate eligibility determination. On the Medicaid side, we have a community engagement tool designed to allow beneficiaries first to navigate whether they actually need to comply with the work requirements, because they may have conditions that meet the qualifications for exemption.
p. 6 · Read in context →
The receivables scare defused: one federal program's retroactive invoicing rework on a funded contract — a timing issue, not a credit risk.
David Mutryn, Chief Financial Officer: A little more detail: this is a large program with extremely complex and data-intensive invoicing requirements. The slowdown in collections has occurred since November as we have worked with our customer on incorporating new and evolving requirements, many of which are retroactive, so may require rework of prior period invoices. This is a federal agency. We are operating under a funded contract, so we have full confidence that the outstanding invoices will be collected.
p. 6 · Read in context →
Q4 & FY2025 Earnings Call — November 20, 2025
The annual strategy call: management frames the One Big Beautiful Bill Act's Medicaid work-requirement and SNAP error-rate provisions as the biggest U.S. Services opening since the ACA, defends margin expansion on flat revenue, and points its M&A at the defense market. · Open the full transcript →
The differentiation claim: the only public peer to document its contract mix — 54.4% performance-based — betting on measurable delivery.
Bruce Caswell, President and CEO: To our knowledge, Maximus is the only public company in our sector that has formally documented its mix of contracts that are performance-based, which stands at 54.4% for fiscal year 2025. We believe this distinction reinforces our leadership in driving accountable and measurable results.
p. 2 · Read in context →
The hardest question — margins up on flat revenue: severance savings, flat SG&A despite growth, and capex rolling into amortization.
David Mutryn, Chief Financial Officer (answering CJS Securities): if you look at the margin guidance we laid out for each of the segments, all three are actually slightly higher than where they finished fiscal year 2025. […] you may notice on the P&L total company SG&A, if you consider that there was $40 million of divestiture charges in the first year in 2025, the rest of SG&A is essentially flat from 2024 to 2025 despite the revenue growth. […] a number of capitalized software projects that have been driving CapEx the past couple of years are now operational and therefore amortizing.
p. 8 · Read in context →
Where the acquisition dollars point: a defense/national-security market growing ~9%, with roughly $50B addressable to Maximus.
Bruce Caswell, President and CEO (answering CJS Securities): We've been fairly explicit with our investors in the marketplace noting that our priority in the near term is growth in the U.S. Federal market. And within that, we do have a bias toward the defense and national security space. Our research suggests that the CAGR in that area over the next several years is north of about 9%. We also believe from our research that the overall services marketplace and software spend in the defense community is well in excess of $150 billion and we believe the addressable component for Maximus to be nearly $50 billion.
p. 9 · Read in context →
Q3 FY2025 Earnings Call — August 7, 2025
The federal cost-cutting stress-test: management quantifies DOGE contract actions at under 0.5% of revenue and lays out the conflict-free, at-scale moat — enrollment broker in ~23 states, ~60% of Medicaid enrollees — that makes the coming work hard for rivals to take. · Open the full transcript →
Why a soft 0.8x book-to-bill misleads: on-contract growth (revenue +4.3%, EBITDA +15%) is its own engine when rebids are light.
Bruce Caswell, President and CEO: These awards translate into a book-to-bill of approximately 0.8x using our standard reporting for the trailing 12-month or TTM period. […] To illustrate, our book-to-bill at the end of the third quarter of fiscal year 2024 was 0.6x. Since then, revenue has grown 4.3% and adjusted EBITDA 15%, underscoring how on-contract growth is another important source of organic growth, providing added strength and resilience to our portfolio.
p. 3 · Read in context →
The moat in one answer: conflict-free, no payer or provider ties, at scale — ~23 states, ~60% of enrollees, where 'scale is everything.'
Bruce Caswell, President and CEO (answering Charles Strauzer, CJS Securities): We've said for many years that we've made a very deliberate decision to remain independent and conflict-free and in particular, have no direct or indirect financial relationships with payers or providers, which is very critical to the work that we do in the Medicaid space and to a certain degree as well with Medicare. […] But I would just say size matters in this market, and we have an established presence as the Medicaid managed care enrollment broker in about 23 states presently. We probably serve roughly 60% of the individuals nationally in the Medicaid program. As evidence in the results this quarter, scale is everything in this area of the business.
p. 8 · Read in context →
How EPS grows without revenue: deleveraging cuts interest expense $20–25M next year, worth roughly $0.30 of EPS.
David Mutryn, Chief Financial Officer (answering CJS Securities): our interest expense could be another tailwind to our EPS. If we look at our projected cash flow right just here ahead of us in the fourth quarter, as well as through next year, absent M&A or share repurchases, the deleveraging we anticipate would drive interest expense being $20 million to $25 million lower next year. So that could be like a $0.30 EPS type year-over-year improvement there.
p. 9 · Read in context →
The direct question on federal contract cuts — SEC, IRS, DOGE — met with a number: conservatively under 0.5% of FY'25 revenue.
Brian Gesuale (Raymond James); Bruce Caswell, President and CEO: Maybe you could talk about what's going on at the SEC as well as maybe anything with the IRS or any other customers that you want to discuss. […] I'm really pleased that the impact of contract actions across our portfolio has been minimal. If we had to put a number on it, conservatively less than 0.5% of our FY '25 revenues.
p. 12 · Read in context →
Q2 FY2025 Earnings Call — May 8, 2025
The first call after the DOGE shock: management puts a number on the damage (~$4M of revenue), explains why an activity-based Medicaid model can gain even as enrollment falls, and defends guidance held deliberately flat — 'downside by design.' · Open the full transcript →
The shock, quantified: DOGE actions total about $4M of FY2025 revenue — de minimis on a $5B+ base — though concession requests have begun.
Bruce Caswell, President and CEO: The impact of DOGE decisions on the business to date has been limited to a handful of small contracts where budget or scope has now been modified, some of which were already scheduled to end this fiscal year. More specifically, to date, these actions are estimated to total about $4 million in FY 2025 revenue, a de minimis figure on our base of $5 billion plus of revenue. […] As an example, like others in our sector, we have fielded requests for pricing concessions on certain contracts, which leads to a process of mutual negotiation in due course.
p. 1 · Read in context →
The counterintuitive defense: because contracts pay per activity, tighter eligibility checks can raise volumes even as rolls shrink.
Bruce Caswell, President and CEO: As discussed in February, changes that require customer engagement, such as verifying eligibility, typically increase our activity volume, which is our primary contracting model for state Medicaid programs. Therefore, a reduction in Medicaid recipients may not necessarily decrease consumer engagement, especially if eligibility verification or activity reporting requirements become more frequent than today. Additionally, in many of our largest states, we also manage state-based exchanges where customers can enroll if they are no longer eligible for Medicaid. This helps maintain our ongoing engagement with those consumers.
p. 3 · Read in context →
The candid admission: civilian-agency pipeline has slowed, but the disruption pushes work into contract bridges that favor incumbents.
Bruce Caswell, President and CEO (answering Charlie Strauzer, CJS Securities): There has been some slowdown, however, and reduction even in the pipeline in the civilian agency space. […] this has led to contract bridges and extensions that benefit incumbents, including Maximus
p. 7 · Read in context →
Q4 & FY2023 Earnings Call — November 16, 2023
The foundational teach on how Maximus makes money: the post-pandemic Medicaid 'redetermination' restart and its outsized flow-through to profit, the segment-margin mechanics behind it, and a portfolio tilting decisively toward federal work. · Open the full transcript →
The three step-ups that reshaped earnings: Medicaid redetermination restart, VA disability-exam volumes, and student-loan servicing.
David Mutryn, Chief Financial Officer: the second half of the year looked quite different from the first half as there were several sizable step-ups in earnings power of the core business as Medicaid redeterminations commenced in the third quarter in US services and volumes ramped on both the Veterans Affairs Medical Disability Exam contracts, which comprise the VES business and the student loan servicing contract in US Federal services.
p. 3 · Read in context →
The margin mechanics of the redetermination cycle: US Services swung from underweight to an 11.6% Q4 margin as paused Medicaid work resumed.
David Mutryn, Chief Financial Officer: Let me recap the margin trend of this segment. Last year, in fiscal 2022, the first half of the year was overweight from the last of the profitable short-term COVID response work, while the second half of the year was underweight. This year, the first half remained underweight until the paused Medicaid redetermination commenced in the third quarter, yielding margin improvement in the back half of the year as we expected. With the full period contribution of redeterminations US services realized an 11.6% margin in the fourth quarter.
p. 4 · Read in context →
Capital-allocation priorities, ranked: organic investment, dividend growth, then M&A — the long-term preference.
David Mutryn, Chief Financial Officer: Looking forward, our capital allocation priorities are unchanged. First, we fund organic investments, which are typically a combination of capital expenditures and expenses. Second, we maintain a dividend that we intend to grow over time with earnings and as evidenced by the recent quarterly dividend increase announcement to $0.30 per quarter. And third, strategic acquisitions intended to accelerate organic growth.
p. 5 · Read in context →
The portfolio shift: U.S. Federal went from under half of backlog two years earlier to two-thirds; a 7% dividend raise signals confidence.
Bruce Caswell, President and CEO: Just two years ago, our US Federal Services Segment accounted for less than half of our backlog. Today, the Segment makes up two-thirds of our backlog. […] During the quarter, we announced a 7% increase in our quarterly dividend, raising it to $0.30 a share. As we stated in the press release, this dividend increase demonstrates our confidence in the earnings growth reflected in our guidance.
p. 8 · Read in context →
The unit economics: redeterminations added ~$15M of quarterly US Services operating income ($40M→$55M), worth $0.15–$0.30 of EPS.
David Mutryn, Chief Financial Officer (answering Charlie Strauzer, CJS Securities): We do continue to see that contribution in line with the $0.15 to $0.30 range that we’ve given before. And I think you can see that just by looking at the total US services OI, which in Q1 and Q2 of fiscal year ’23 was more in the $40 million range per quarter. And then in Q4, it was at $55 million. So kind of a $15 million OI increase really driven by the redeterminations.
p. 14 · Read in context →
More calls
Q1 FY2026 Earnings Call — February 5, 2026 · 11 pages · The deep dive on sizing and timing the Medicaid/SNAP opportunity: management estimates a high-single to low-double-digit organic run-rate for U.S. Services by FY2028 and walks through SNAP's 6% error-rate funding trigger. · Open →
Q1 FY2025 Earnings Call — February 6, 2025 · 8 pages · Early-transition resilience: the durable, entitlement-tied portfolio that survived the federal hiring freeze and OMB grant pause, plus the secured CMS Contact Center and VA disability-exam rebids. · Open →
Q4 & FY2024 Earnings Call — November 20, 2024 · 12 pages · The annual call on the eve of the Trump transition: how a ~50-year government partner prepares for procurement delays and DOGE, why it de-risked FY2025 guidance to ~2% new work, and the switch to reporting adjusted EBITDA. · Open →
Q3 FY2024 Earnings Call — August 7, 2024 · 10 pages · The contested $6.6B CMS Contact Center recompete and GAO protest, cost-plus contract economics, election-outcome resilience, and how FY2024's excess redetermination volumes normalize into FY2025. · Open →
Q2 FY2024 Earnings Call — May 8, 2024 · 9 pages · The Medicaid 'unwind' ends and reverts to business-as-usual, both domestic segments hit the top of their margin targets, and management weighs whether to even bid the labor-harmony CCO recompete. · Open →
Q1 FY2024 Earnings Call — February 7, 2024 · 10 pages · Why volumes swing profit disproportionately — 53% of revenue is performance-based — with the redetermination margin at a 13.5% high-water mark and the cost-plus CCO contract's economics disclosed. · Open →
Q3 FY2023 Earnings Call — August 3, 2023 · 8 pages · The mechanics of the Medicaid redetermination ramp: why volumes built slowly (ex parte renewals, hard-to-reach cohorts), plus the student-loan repayment restart and a MOVEit cyber charge. · Open →
Q4 & FY2021 Earnings Call — November 18, 2021 · 26 pages · The COVID-era playbook: standing up ~13,000 agents fast on a variable-cost model, four acquisitions including the Aidvantage student-loan servicing entry, and a back-loaded FY2022 built on the UK Restart program. · Open →
Maximus, Inc.'s annual reports contain management's most considered account of the business. These are the sections, passages and visual pages worth opening in the originals preserved in Sources.
Maximus, Inc. — FY2025 Annual Report (Form 10-K) — FY2025
Latest 10-K; the fullest account of how a government-services contractor earns, where its revenue concentrates, and the policy/budget risks that could bite. · Open the full document →
Item 1. Business — General — p. 8 · Read the full section →
The core self-definition: a tech-enabled services provider that turns public policy into operating models delivered at scale.
What Maximus is and how it says it creates value.
Maximus, a Virginia corporation established in 1975 and celebrating its 50th anniversary this year, is a leading provider of tech-enabled services to government agencies. […] We create value for our customers through our ability to translate public policy into operating models that achieve outcomes for governments at scale.
p. 8 · Read in context →
Item 1. Business — Our Business Segments — p. 9 · Read the full section →
Defines the three operating segments and the revenue concentration — U.S. Federal Services alone is 56% of the top line.
Three segments; U.S. Federal Services is the majority of revenue.
We operate our business through three segments: U.S. Federal Services, U.S. Services, and Outside the U.S. We operate in the United States and worldwide. […] Our U.S. Federal Services Segment generated 56% of our total revenue in fiscal year 2025.
p. 9 · Read in context →
Item 1A. Risk Factors — p. 22 · Read the full section →
The two risks specific to this business model: dependence on government appropriations/shutdowns, and cyber breaches of the citizen data it holds.
Custodian of citizen and health data — a breach threatens contracts, sanctions and client confidence.
The risk of a security breach, system disruption, ransom-ware attack, or similar cyber-attack or intrusion, including by computer hackers, cyber terrorists, or foreign governments, is persistent, substantial, and increases as the volume, intensity, and sophistication of attempted attacks, intrusions and threats from around the world increase daily. […] The loss, theft, or improper disclosure of that information could subject us to sanctions under the relevant laws, breach of contract claims, contract termination, class action, or individual lawsuits from affected parties, negative press articles, reputational damage, and a loss of confidence from our government clients, all of which could adversely affect our existing business, future opportunities, and financial condition.
p. 29 · Read in context →
Item 1C. Cybersecurity — p. 41 · Read the full section →
Discloses the FY2023 MOVEit incident as a material event — the concrete instance of the breach risk, with governance detail.
The material FY2023 incident: a zero-day in a third-party file-transfer vendor exposed personal data.
We have experienced cybersecurity incidents that were immaterial and, as previously disclosed, in the third quarter of fisca year 2023, we experienced a material cybersecurity incident as the personal information of a significant number of individuals was accessed by an unauthorized third-party exploiting a zero-day vulnerability in a third-party vendor's file transfer application used by many organizations, including us.
p. 41 · Read in context →
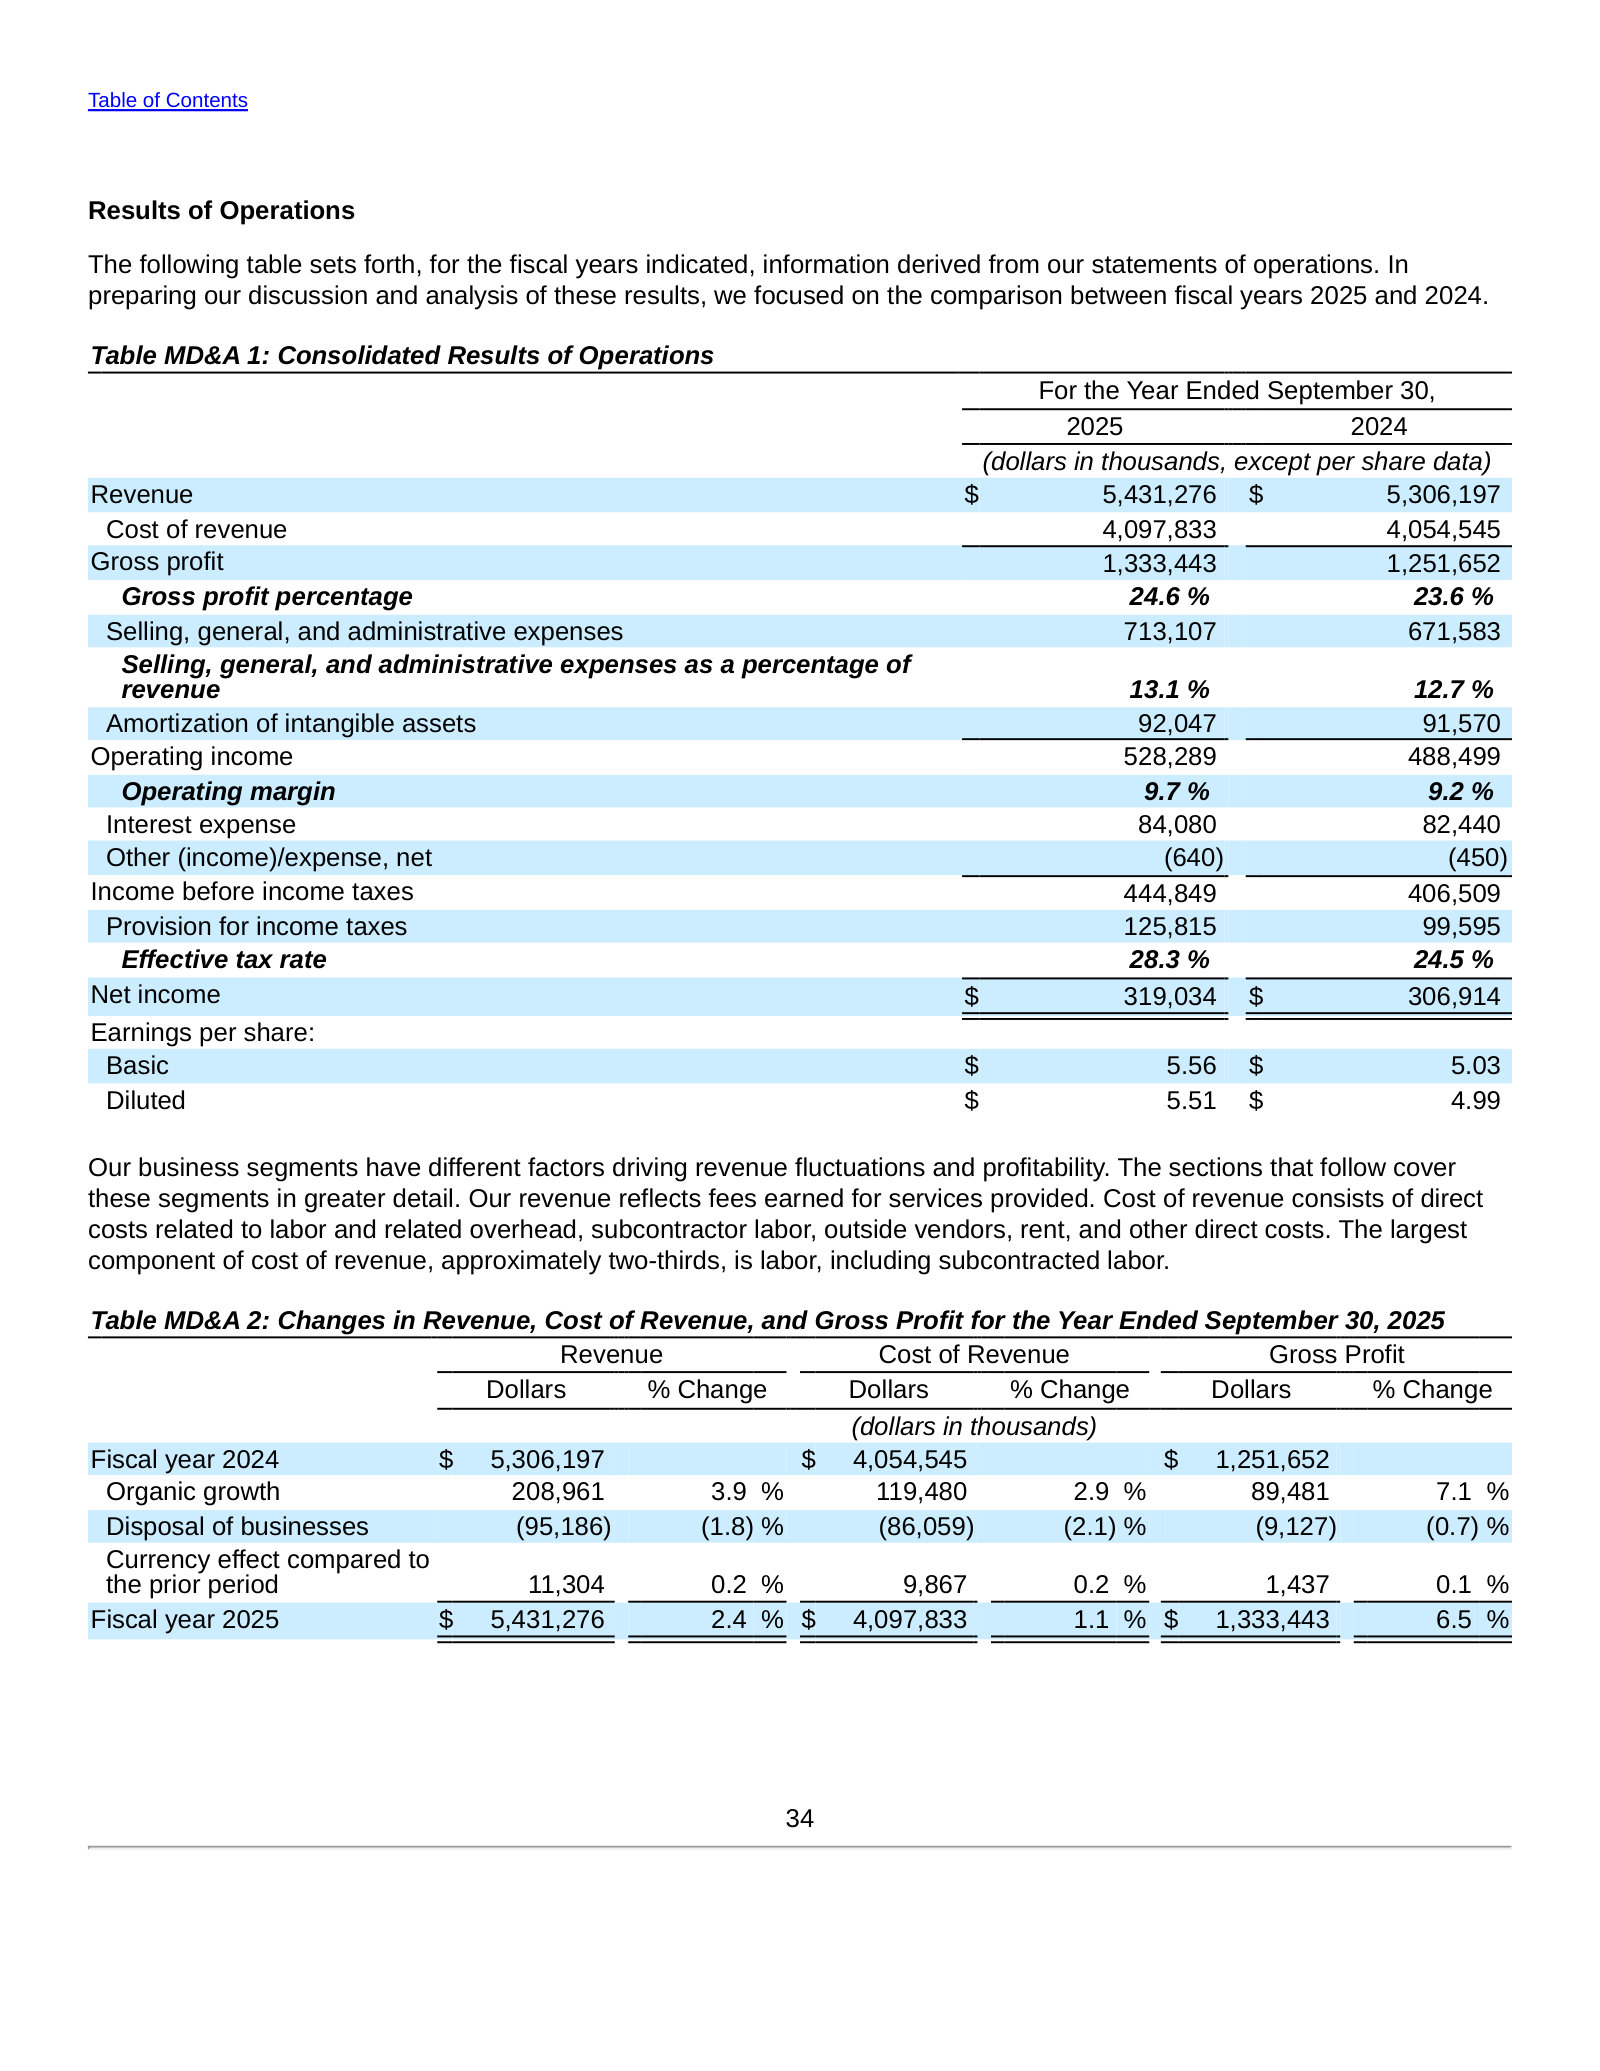
Item 7. MD&A — Results of Operations — p. 49 · Read the full section →
The consolidated P&L plus a revenue bridge that separates organic growth from the Outside-U.S. divestitures and FX.
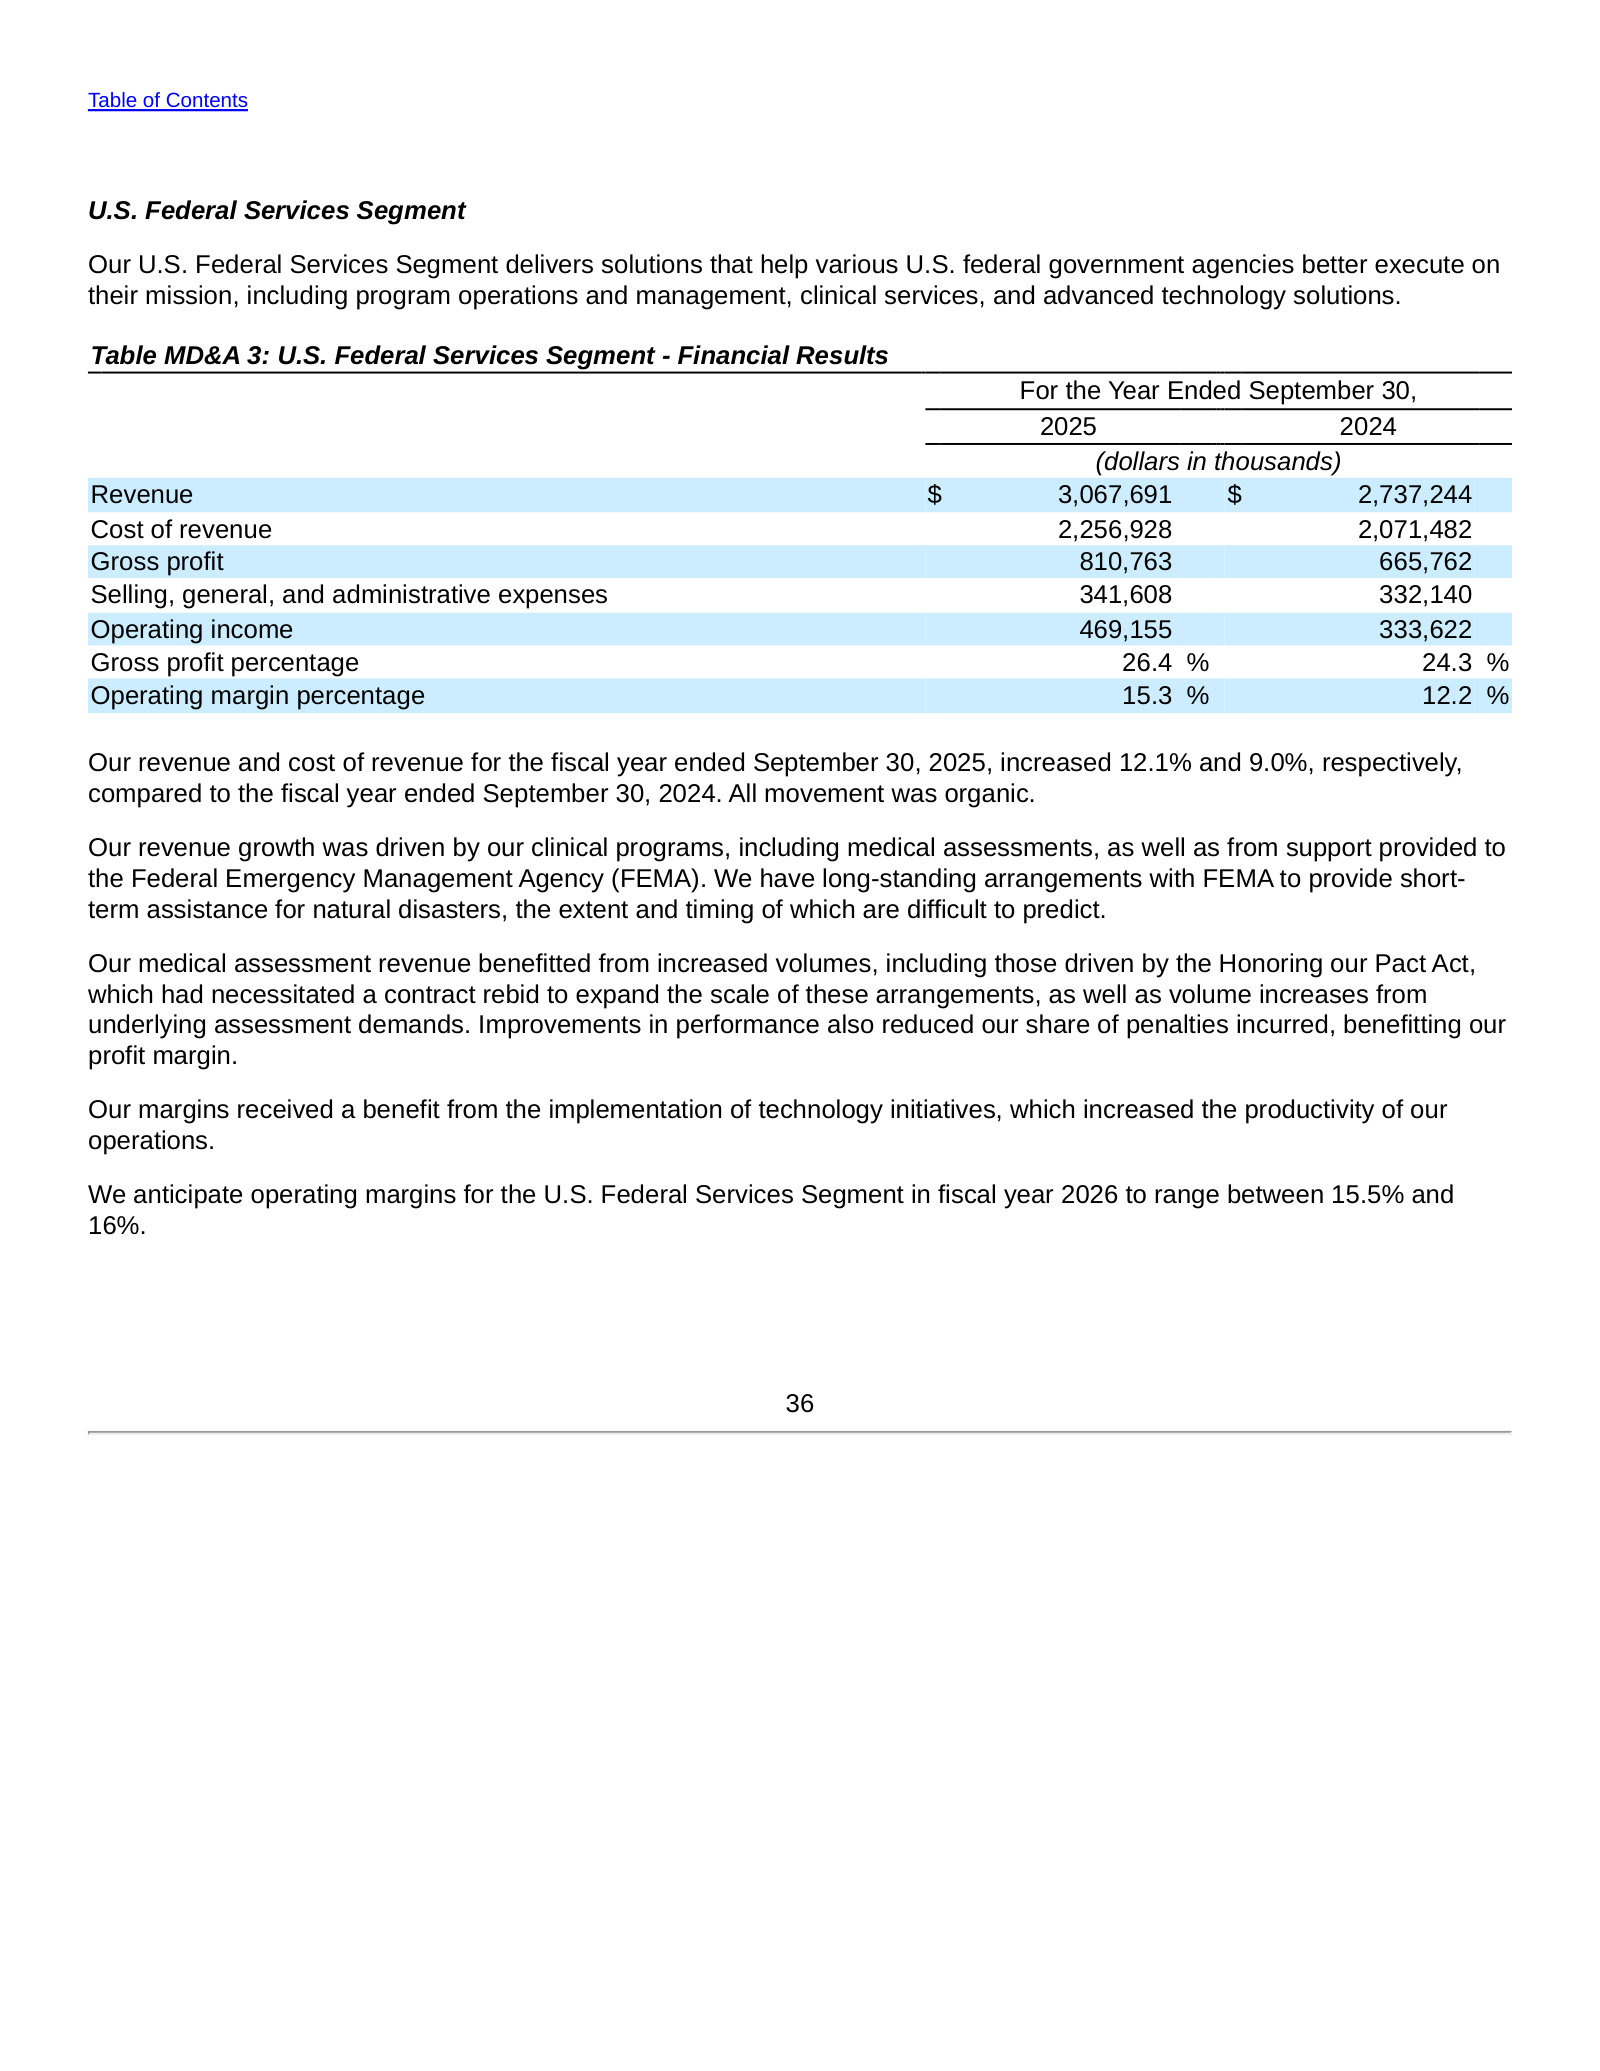
Item 7. MD&A — U.S. Federal Services Segment — p. 51 · Read the full section →
Management's own account of what drove the year: clinical/medical assessments, the PACT Act, and FEMA disaster support lifting margin to 15.3%.
The growth drivers: clinical programs, FEMA support and PACT Act–driven assessment volumes.
Our revenue growth was driven by our clinical programs, including medical assessments, as well as from support provided to the Federal Emergency Management Agency (FEMA). […] Our medical assessment revenue benefitted from increased volumes, including those driven by the Honoring our Pact Act, which had necessitated a contract rebid to expand the scale of these arrangements, as well as volume increases from underlying assessment demands.
p. 51 · Read in context →
Item 7. MD&A — Backlog — p. 54 · Read the full section →
Revenue visibility for a contractor: $15.3bn of backlog with a ~5.0-year weighted remaining life, split by segment.
Item 7. MD&A — Free Cash Flow and Credit Facilities — p. 56 · Read the full section →
The non-GAAP free-cash-flow reconciliation and the $1.35bn term-loan schedule that debt reduction is prioritized against.
Critical Accounting Policies — Revenue Recognition — p. 59 · Read the full section →
The policy that defines the model: performance-based contracts carry variable consideration estimated by expected value and constrained against reversal.
Penalties and incentives are variable consideration, estimated and constrained each period.
Certain performance-based contracts include variable consideration in the form of penalties and incentives, based on our performance under the terms of the contract. The calculation of these penalties and incentives requires the evaluation of both objective and subjective criteria, which may require the use of estimates. […] We estimate the total variable consideration we will receive using the expected value method. […] We are required to constrain our estimates to the extent that it is probable that there will not be a significant reversal of cumulative revenue when the uncertainty is resolved.
p. 59 · Read in context →
More annual reports
Maximus, Inc. — FY2024 Annual Report (Form 10-K) — FY2024 · 117 pages · The prior year's baseline for the FY2025 comparisons — revenue $5.31bn and the segment mix before further Outside-U.S. divestitures. · Open →
Maximus, Inc. — FY2023 Annual Report (Form 10-K) — FY2023 · 114 pages · First disclosure of the MOVEit cybersecurity incident and the start of the Outside-U.S. reshaping/divestiture program. · Open →
Maximus, Inc. — FY2022 Annual Report (Form 10-K) — FY2022 · 119 pages · The pre-divestiture Outside-U.S. footprint and peak pandemic-response work, useful as an evolution reference. · Open →
Maximus, Inc. — FY2021 Annual Report (Form 10-K) — FY2021 · 124 pages · The earliest edition on the shelf — segment structure and disclosures before the recent strategy reset. · Open →
Competitors describe Maximus, Inc.'s market in their own filings and calls. These verified passages and visual pages show where their strategies meet, using source documents preserved in Sources.
Conduent (CNDT)
The closest US-listed pure-play government-services BPO rival to Maximus: its Government segment administers Medicaid healthcare, eligibility and enrollment, benefits payments and case management for federal, state and local agencies — the same programs that anchor Maximus's US Services and US Federal Services segments.
Conduent's own sizing of the business-process-services market it and Maximus compete in — an addressable $219 billion in 2025 where it claims analyst-recognized leadership.
We estimate our addressable market size in the global business process services industry to be $219 billion in 2025, according to third-party industry reports. Many industry analysts and advisors place us as a leader across several segments in this large, diverse and growing market.
p. 7 · Read in context →
Conduent's description of its government portfolio reads as a point-for-point overlap with Maximus's core work — Medicaid claims, eligibility determination, enrollment and benefits delivery for state agencies.
Our government portfolio includes government healthcare, eligibility and enrollment solutions, digital payments and child support payments, ensuring efficient Medicaid healthcare claims processing and delivery of benefits to the most vulnerable populations while reducing the risk of fraud. Our solutions help state agencies determine eligibility, streamline enrollment, adjudicate claims and meet requirements for government-funded healthcare programs.
p. 5 · Read in context →
On its Q1 FY2026 call, Conduent quantifies a re-entry into the federal health-and-human-services market — Maximus's home turf — led by a $23 million government-Medicaid-claims win.
Cliff Skelton, President & CEO: In the Public Sector segment, we signed more than $66 million in new business in Q1. This was driven by a large deal in government Medicaid claims for $23 million in new business.
p. 2 · Read in context →
Serco Group (SRP.L)
A global government-services outsourcer that competes head-on with Maximus in US and UK citizen services — most directly through Serco Inc.'s CMS Eligibility Support Services contract running eligibility and contact-center support for the health-insurance Exchanges, the franchise at the heart of Maximus.
Serco's FY2025 report details its CMS Eligibility Support Services contract — eligibility and enrollment support for the ACA health-insurance Exchanges, the same CMS work that is Maximus's flagship US contract.
CMS Eligibility Support Services contract: In July 2023, Serco Inc. was awarded a follow-on contract with the US Government (acting through the Centers for Medicare and Medicaid Services (CMS)) for the provision of support for the Exchanges implemented to provide affordable health insurance and insurance affordability programmes.
p. 131 · Read in context →
Serco management sizes its US government-services business and frames the runway — a $2 billion portfolio it estimates is still only just over 1% of the market Maximus also serves.
Anthony Kirby, CEO: In recent years, we've doubled the revenue and tripled the profit of our U.S. business to a $2 billion portfolio, delivering 10% margins, and we estimate that we still only have just over 1% market share.
p. 10 · Read in context →
Serco reports a decade-high bid pipeline, a measure of the competitive capacity chasing the same government contracts Maximus bids for.
Our pipeline was £12.1bn at the end of December 2025, 8% higher than the £11.2bn level at the end of December 2024 and the highest level in over a decade. The pipeline consists of over 70 bids, with an average ACV of £30m and an average contract length of around five years.
p. 25 · Read in context →
Capita (CPI.L)
The UK government's self-described number-one BPS supplier and the one competitor that names Maximus directly; its Public Service division runs the Health Assessment Advisory Service and other citizen-services contracts that collide with Maximus's UK health-and-disability-assessment and welfare-to-work businesses.
Capita's Public Service division lists its competitors in the UK government market and names Maximus explicitly — the one direct competitor filing in this set to do so.
Public Service operates in highly fragmented markets with a variety of services offered. Competitors within the market include but are not limited to: Atos, G4S, Sopra Steria, CGI, Tata Consulting Services, Serco, Accenture and Maximus.
p. 8 · Read in context →
Capita attributes Public Service growth to the Health Assessment Advisory Service and disability-related contract wins — precisely the UK clinical-assessment and welfare lines Maximus operates.
strong performance in Public Service which saw growth from the Health Assessment Advisory Service and Disabled Student Allowance contract wins and growth from existing contracts including Transport for London and the Royal Navy training contract.
p. 7 · Read in context →
Capita quantifies its UK government contract-win momentum — £1.19bn of total contract value, up 28% — including an NHS England contract, a benchmark of competitive scale against Maximus's UK footprint.
Across 2025, Public Service won contracts with a TCV of £1,185.8m, up 28% from 2024. There were material wins with Education Authority Northern Ireland, Gas Safe Register and with NHS England on our PCSE contract and a further expansion of scope on our successful contracts with the Royal Navy.
p. 9 · Read in context →
Leidos (LDOS)
Through Leidos QTC, the largest provider of government-outsourced medical disability examinations — the clinical-assessment business Maximus also performs for the VA and, internationally, through its health-assessment contracts. Its Health & Civil segment is a direct read on that market's economics.
Leidos reports high veterans' disability-exam volume through its QTC clinics — the government medical-examination business it and Maximus both compete in.
Tom Bell, CEO: in our ongoing Veterans Benefits exam business, I'm pleased to report that our disability exam volume remained high through the first quarter and customer satisfaction, veteran satisfaction with their treatment at Leidos QTC clinics remains best in class.
p. 2 · Read in context →
Leidos ties its Health & Civil segment's ~25% margin to medical-disability-exam volume — a benchmark for the profitability of the clinical-assessment work Maximus performs.
Health and Civil revenues increased by 1% year-over-year, with a non-GAAP operating income margin of 24.9%. Sustaining high performance levels was due to a consistent high volume of medical disability exams and our team's unwavering focus on delivering excellent innovation.
p. 3 · Read in context →
Leidos management acknowledges the VA disability-exam market is a contested multi-vendor field — a fourth provider has entered — the same competitive dynamic that shapes Maximus's exam share.
Tom Bell, CEO: As you may have noticed, a fourth provider has been introduced in some regions, and we recognize that we need to stay ahead of the competition through innovation and technology, ensuring strong performance and customer satisfaction.
p. 7 · Read in context →
ICF International (ICFI)
A federal-focused consulting and digital-services firm whose largest client is HHS — overlapping Maximus's health-and-human-services and government-modernization work — and whose disclosures document the DOGE-era budget pressure that is the shared macro risk for government-services vendors.
ICF quantifies its federal-government dependence and names HHS among its most significant clients — the same federal-health demand pool Maximus relies on — with federal revenue falling to 43% in 2025.
Our largest clients are U.S. federal government departments and agencies. Our federal government clients include every cabinet-level department, most significantly HHS, DoD, DoE, and DoT. Federal government clients generated approximately 43%, 54%, and 55% of our revenue in 2025, 2024, and 2023, respectively.
p. 38 · Read in context →
ICF discloses DOGE-driven contract terminations and stop-work orders in early 2025 — concrete evidence of the federal-spending disruption that is the shared risk across Maximus's peer set.
we received contract terminations and temporary stop-work orders primarily in the first and second quarters of 2025. We expect that, due to changing government budgeting and spending priorities
p. 19 · Read in context →
SAIC (SAIC)
A large federal IT and digital-modernization contractor; while defense-weighted, its priority civilian segment serves the same civilian agencies (Treasury/IRS, State, DHS, DOT/FAA) that fund Maximus's citizen-services and modernization work, making its federal-demand read-through relevant.
SAIC's CEO sizes the FY2026 civilian-agency funding backdrop — DOT/FAA and DHS budgets — the same non-defense federal pool that funds Maximus's government-services work.
Toni Townes-Whitley, CEO: Regarding nondefense budgets, the areas of focus for Science Applications International Corporation at our five largest civilian agency customers were well supported, including over $1 billion of additional budget for the Department of Transportation to fund improvements at the FAA. Over $40 billion to the Department of Homeland Security, focused in part on procuring advanced border security technology.
p. 2 · Read in context →
SAIC management frames its separately-reported civilian business as a priority growth area — the civilian-agency digital-modernization space Maximus also targets.
Toni Townes-Whitley, CEO: So let's start with our civilian business. As you know, we report that separately. We've been focusing on really over even over the last year as we said the civilian business was a critical one for us. We want to see further growth in that business, and we have seen quite frankly growth in that business.
p. 6 · Read in context →
More peer documents
Q4_FY2025 — 9 pages · Conduent's FY2025 wrap-up, with CEO commentary sizing US Medicare/healthcare spending and the eligibility complexity created by new legislation — the demand backdrop for the health-program market. · Open →
CNDT_annual_report_FY2024 — 100 pages · Prior-year 10-K with the same Government-segment and Medicaid-services description — useful for a two-year view of Conduent's public-sector positioning against Maximus. · Open →
Q2_FY2024 — 17 pages · Serco calls its CMS health-eligibility contract a group-wide benchmark for technology-enabled productivity — the automation narrative that overlaps Maximus's ACA/Medicaid franchise. · Open →
LDOS_annual_report_FY2025 — 117 pages · Leidos 10-K Health & Civil segment detail — segment revenue scale (~$5bn) and margins that frame the government-health/medical-exam market Maximus competes in. · Open →
Q4_FY2025 — 13 pages · Leidos quantifies a ~60% cut in the VA exam backlog and flags the 2026 disability-exam recompete — the contract dynamics driving competition for exam share. · Open →
Q4_FY2025 — 13 pages · ICF reports ~$1.1bn of 2025 federal awards and a high-single-digit 2026 federal-revenue-decline outlook — a peer read on federal award momentum and the DOGE-era demand reset. · Open →
SAIC_annual_report_FY2025 — 100 pages · SAIC 10-K with total backlog of ~$22.6bn (Civilian ~$4.2bn) and the continuing-resolution funding backdrop — a scale and budget-environment benchmark for government-services vendors. · Open →
Q4_FY2024 — 19 pages · Capita's results call, with a ~£19.8bn unweighted pipeline and improved win rates — competitive-capacity detail behind its UK Public Service positioning versus Maximus. · Open →
Source: S&P Capital IQ consensus via Xpressfeed · Generated 2026-07-19.
Street snapshot
Coverage is thin at two analysts, both rating the stock outperform, for a consensus recommendation score of 2. Their price targets span USD 85 to 125 around a 105 mean and median.
Currency: USD · Scale: money in millions, absolute (per share) · Analyst counts shown explicitly; recommendation respondents: 2.
| Street view | Reading | Analysts |
|---|---|---|
| Recommendation mix | Buy 0, Outperform 2, Hold 0, Underperform 0, Sell 0 | 2 |
| Consensus score | 2.00 | 2 |
| Target price | mean 105.0; high 125.0; low 85.00 | 2 |
Forward table
Revenue is seen dipping from about USD 5,454m in FY2025 to USD 5,296m in FY2026 before recovering to USD 5,551m in FY2027, while normalized EPS still climbs from 7.45 to 9.07 and gross margin edges up from 24.4% toward 25%. EBITDA rises across the window from 707m to 784m, so the earnings path looks driven more by margin than by top-line growth.
Currency: USD · Scale: money in millions, absolute (per share) · Analyst count is the estimate count for each period and metric.
| Period | Metric | Mean | YoY | Analysts | Low / high |
|---|---|---|---|---|---|
| FY0E | Revenue | 5,296 | -2.5% | 2 | 5,274 / 5,318 |
| FY0E | EBITDA | 749.5 | 6.8% | 2 | 747.9 / 751.0 |
| FY0E | EBIT | 619.9 | 15.4% | — | — / — |
| FY0E | Net income (GAAP) | 404.4 | 26.8% | 2 | 403.3 / 405.5 |
| FY0E | Net income (normalized) | 459.9 | 6.7% | — | — / — |
| FY0E | EPS (GAAP) | 7.43 | 34.9% | 2 | 7.41 / 7.46 |
| FY0E | EPS (normalized) | 8.44 | 14.6% | 2 | 8.40 / 8.47 |
| FY0E | Gross margin | 25.4% | 4.1% | — | — / — |
| FY+1E | Revenue | 5,551 | 4.8% | 2 | 5,503 / 5,598 |
| FY+1E | EBITDA | 784.0 | 4.6% | 2 | 767.9 / 800.2 |
| FY+1E | EBIT | 653.6 | 5.4% | — | — / — |
| FY+1E | Net income (GAAP) | 427.6 | 5.7% | 2 | 424.5 / 430.7 |
| FY+1E | Net income (normalized) | 490.6 | 6.7% | — | — / — |
| FY+1E | EPS (GAAP) | 7.96 | 7.0% | 2 | 7.86 / 8.05 |
| FY+1E | EPS (normalized) | 9.07 | 7.5% | 2 | 8.95 / 9.19 |
| FY+1E | Gross margin | 25.3% | -0.4% | — | — / — |
| Q3 FY2026 | Revenue | 1,327 | -1.6% | 2 | 1,311 / 1,344 |
| Q3 FY2026 | EBITDA | 192.5 | -2.9% | 2 | 188.9 / 196.1 |
| Q3 FY2026 | EBIT | 159.9 | 36.6% | — | — / — |
| Q3 FY2026 | Net income (GAAP) | 103.7 | -2.1% | 2 | 100.7 / 106.8 |
| Q3 FY2026 | Net income (normalized) | 121.7 | 31.1% | — | — / — |
| Q3 FY2026 | EPS (GAAP) | 1.93 | 3.5% | 2 | 1.87 / 1.98 |
| Q3 FY2026 | EPS (normalized) | 2.21 | 2.1% | 2 | 2.15 / 2.26 |
| Q3 FY2026 | Gross margin | 25.7% | 11.0% | — | — / — |
| Q4 FY2026 | Revenue | 1,317 | -0.1% | 2 | 1,311 / 1,323 |
| Q4 FY2026 | EBITDA | 198.5 | 23.9% | 2 | 196.5 / 200.5 |
| Q4 FY2026 | EBIT | 165.9 | 26.1% | — | — / — |
| Q4 FY2026 | Net income (GAAP) | 109.2 | 45.0% | 2 | 107.9 / 110.5 |
| Q4 FY2026 | Net income (normalized) | 122.9 | 25.4% | — | — / — |
| Q4 FY2026 | EPS (GAAP) | 2.04 | 54.2% | 2 | 2.02 / 2.05 |
| Q4 FY2026 | EPS (normalized) | 2.31 | 42.3% | 2 | 2.28 / 2.33 |
| Q4 FY2026 | Gross margin | 26.0% | 6.1% | — | — / — |
| Q1 FY2027 | Revenue | 1,409 | 4.8% | 1 | 1,409 / 1,409 |
| Q1 FY2027 | EBITDA | 200.7 | 17.8% | 1 | 200.7 / 200.7 |
| Q1 FY2027 | EBIT | 167.4 | 21.9% | — | — / — |
| Q1 FY2027 | Net income (GAAP) | 107.6 | 14.6% | 1 | 107.6 / 107.6 |
| Q1 FY2027 | Net income (normalized) | 122.6 | 12.7% | — | — / — |
| Q1 FY2027 | EPS (GAAP) | 2.02 | 18.8% | 1 | 2.02 / 2.02 |
| Q1 FY2027 | EPS (normalized) | 2.31 | 24.9% | 1 | 2.31 / 2.31 |
| Q1 FY2027 | Gross margin | 25.1% | 9.6% | — | — / — |
| Q2 FY2027 | Revenue | 1,380 | 5.7% | 1 | 1,380 / 1,380 |
| Q2 FY2027 | EBITDA | 195.4 | 3.9% | 1 | 195.4 / 195.4 |
| Q2 FY2027 | EBIT | 163.1 | 14.1% | — | — / — |
| Q2 FY2027 | Net income (GAAP) | 104.5 | 6.6% | 1 | 104.5 / 104.5 |
| Q2 FY2027 | Net income (normalized) | 119.5 | 8.6% | — | — / — |
| Q2 FY2027 | EPS (GAAP) | 1.96 | 8.9% | 1 | 1.96 / 1.96 |
| Q2 FY2027 | EPS (normalized) | 2.24 | 8.2% | 1 | 2.24 / 2.24 |
| Q2 FY2027 | Gross margin | 25.0% | 4.6% | — | — / — |
Estimate momentum
Only FY2027 carries revision history here. Over the past 180 days normalized EPS consensus rose from 8.68 to 9.07 while revenue was trimmed from 5,741m to 5,551m, and both were essentially unchanged over the last 30 days.
Currency: USD · Scale: money in millions, absolute (per share) · Point-in-time consensus; analyst count is shown where supplied.
| Period | Metric | Lookback | Then | Now | Direction / magnitude | Analysts |
|---|---|---|---|---|---|---|
| 2027 | EPS (normalized) | 30d | 9.07 | 9.07 | flat 0.0% | — |
| 2027 | EPS (normalized) | 90d | 9.12 | 9.07 | down 0.5% | — |
| 2027 | EPS (normalized) | 180d | 8.68 | 9.07 | up 4.5% | — |
| 2027 | Revenue | 30d | 5,551 | 5,551 | flat 0.0% | — |
| 2027 | Revenue | 90d | 5,680 | 5,551 | down 2.3% | — |
| 2027 | Revenue | 180d | 5,741 | 5,551 | down 3.3% | — |
Beat / miss record
Across the last eight quarters normalized EPS has beaten consensus in six, including outsized 45.7% and 40.7% surprises in the quarters ended March and June 2025. Revenue is more mixed, swinging from mid-single-digit beats into three straight small misses in the most recent quarters.
Current sequences by metric: Revenue: 3 consecutive misses; EPS (normalized): 2 consecutive beats.
Currency: USD · Scale: money in millions, absolute (per share) · Consensus is captured before each actual first became effective; analyst count shown per observation.
| Quarter | Metric | Consensus as of | Actual | Surprise | Outcome | Analysts |
|---|---|---|---|---|---|---|
| Q2 FY2026 | Revenue | 1,318 | 1,306 | -0.9% | Miss | — |
| Q2 FY2026 | EPS (normalized) | 1.97 | 2.07 | 5.3% | Beat | — |
| Q1 FY2026 | Revenue | 1,375 | 1,345 | -2.2% | Miss | — |
| Q1 FY2026 | EPS (normalized) | 1.82 | 1.85 | 1.6% | Beat | — |
| Q4 FY2025 | Revenue | 1,341 | 1,318 | -1.7% | Miss | — |
| Q4 FY2025 | EPS (normalized) | 1.67 | 1.62 | -3.0% | Miss | — |
| Q3 FY2025 | Revenue | 1,316 | 1,348 | 2.5% | Beat | — |
| Q3 FY2025 | EPS (normalized) | 1.53 | 2.16 | 40.7% | Beat | — |
| Q2 FY2025 | Revenue | 1,294 | 1,362 | 5.2% | Beat | — |
| Q2 FY2025 | EPS (normalized) | 1.38 | 2.01 | 45.7% | Beat | — |
| Q1 FY2025 | Revenue | 1,289 | 1,403 | 8.8% | Beat | — |
| Q1 FY2025 | EPS (normalized) | 1.37 | 1.61 | 17.5% | Beat | — |
| Q4 FY2024 | Revenue | 1,307 | 1,316 | 0.7% | Beat | — |
| Q4 FY2024 | EPS (normalized) | 1.48 | 1.46 | -1.4% | Miss | — |
| Q3 FY2024 | Revenue | 1,285 | 1,315 | 2.3% | Beat | — |
| Q3 FY2024 | EPS (normalized) | 1.52 | 1.74 | 14.7% | Beat | — |
Where the street disagrees
With no more than two estimates behind any line, dispersion signals are weak.
Currency: USD · Scale: money in millions, absolute (per share) · Dispersion is high-low divided by absolute mean; analyst count shown per item.
| Period | Metric | Mean | Low | High | Spread / mean | Analysts |
|---|---|---|---|---|---|---|
| Q3 FY2025 | Net income (GAAP) | 71.44 | 67.00 | 75.87 | 12.4% | 2 |
| Q1 FY2026 | Net income (GAAP) | 87.00 | 82.20 | 91.80 | 11.0% | 2 |
| Q3 FY2025 | EPS (GAAP) | 1.24 | 1.17 | 1.30 | 10.5% | 2 |
| Q1 FY2026 | EBITDA | 172.4 | 164.6 | 180.3 | 9.1% | 2 |
| Q3 FY2025 | EPS (normalized) | 1.53 | 1.47 | 1.60 | 8.5% | 2 |
Source: Visible Alpha consensus via S&P Xpressfeed · Consensus as of 2026-05-12 · generated 2026-07-19.
Model trust
Base currency: USD · VA scales normalized from Abs, M; item currencies and units retained · Coverage depth and vintage; broker count is the maximum represented.
| Brokers | Line items | Last revision |
|---|---|---|
| 1 | 154 | 2026-05-12 |
Caution: Coverage is thin at 1 broker.
Operating KPIs
The model carries no company-specific operating drivers, so only standardized financials are available.
Base currency: USD · VA scales normalized from Abs, M; item currencies and units retained · FY-1A / FY0E / FY+1E; broker count shown per KPI.
| Operating KPI | Source | FY-1A | FY0E | FY+1E | Brokers |
|---|---|---|---|---|---|
| (Increase)/decrease in property, plant & equipment | SD | -73,686.00bn Amount | — | -88,000.00bn Amount | 1 |
| (Increase)/decrease in working capital | SD | 51,800.02bn Amount | 53,974.01bn Amount | -12,002.55bn Amount | 1 |
| Accounts payable | SD | 304,783.63bn Amount | 319,433.41bn Amount | 321,244.90bn Amount | 1 |
| Accounts payable and accrued expense | SD | 548,610.53bn Amount | 569,424.77bn Amount | 572,653.95bn Amount | 1 |
| Accounts payable, Average | SD | 304,052.31bn Amount | 312,108.52bn Amount | 316,367.54bn Amount | 1 |
| Accrued expense | SD | 243,826.90bn Amount | 249,991.36bn Amount | 251,409.05bn Amount | 1 |
| Assets / Equity(%) | SD | 237.0% | 208.2% | 188.6% | 1 |
| Assets turnover(x) | SD | 1.28 Ratio | 1.25 Ratio | 1.27 Ratio | 1 |
| Capital employed | SD | 3,132,791.12bn Amount | 3,308,932.32bn Amount | 3,366,158.05bn Amount | 1 |
| Capital employed, Average | SD | 3,076,388.06bn Amount | 3,220,861.72bn Amount | 3,287,139.88bn Amount | 1 |
| Cash & cash equivalents | SD | 403,432.31bn Amount | 617,808.53bn Amount | 597,790.81bn Amount | 1 |
| Cash & cash equivalents, Beginning | SD | — | 825,676.60bn Amount | 894,449.54bn Amount | 1 |
P&L bridge
Base currency: USD · VA scales normalized from Abs, M; item currencies and units retained · Margins are derived against revenue; YoY compares adjacent fiscal columns; broker count shown per line.
| P&L line | FY-1A | FY0E | FY+1E | Brokers |
|---|---|---|---|---|
| Revenue | 5,467,454.89bn Amount | 5,651,996.23bn Amount (3.4% YoY) | 5,844,021.84bn Amount (3.4% YoY) | 1 |
| Gross Profit | 1,327,206.38bn Amount (24.3% margin) | 1,347,761.00bn Amount (23.8% margin; 1.5% YoY) | 1,356,809.75bn Amount (23.2% margin; 0.7% YoY) | 1 |
| Ebitda | 713,441.81bn Amount (13.0% margin) | 735,176.72bn Amount (13.0% margin; 3.0% YoY) | 717,261.18bn Amount (12.3% margin; -2.4% YoY) | 1 |
| Operating Income | 541,955.81bn Amount (9.9% margin) | 603,776.72bn Amount (10.7% margin; 11.4% YoY) | 576,861.18bn Amount (9.9% margin; -4.5% YoY) | 1 |
| Net Income | 432,447.96bn Amount (7.9% margin) | 448,864.89bn Amount (7.9% margin; 3.8% YoY) | 416,825.20bn Amount (7.1% margin; -7.1% YoY) | 1 |
| Eps | 7.45 Amount | 7.70 Amount (3.3% YoY) | 7.13 Amount (-7.4% YoY) | 1 |
Consensus dispersion
With a single contributing broker on every item, minimum, maximum and quartiles collapse onto the point estimate and standard deviation is zero, so there is no consensus dispersion to interpret. Any disagreement in the investment debate is simply not visible in this data.
Base currency: USD · VA scales normalized from Abs, M; item currencies and units retained · Top high-low spreads relative to absolute mean; requires at least 3 brokers.
| Line item | Period | Mean | Min | Q1 | Q3 | Max | Spread / mean | Brokers |
|---|---|---|---|---|---|---|---|---|
| No qualifying dispersion | — | — | — | — | — | — | — | — |
Quarterly path
Base currency: USD · VA scales normalized from Abs, M; item currencies and units retained · Next four supplied quarters; final column is maximum broker coverage in the row.
| Quarter | (Increase)/decrease in property, plant & equipment | (Increase)/decrease in working capital | Accounts payable | Accounts payable and accrued expense | Accounts payable, Average | Total revenue | EPS Diluted, Applicable to common stockholders($) | Broker coverage |
|---|---|---|---|---|---|---|---|---|
| 4QFY-2026 | — | 68,269.57bn Amount | 319,433.41bn Amount | 569,424.77bn Amount | 306,497.65bn Amount | 1,388,840.90bn Amount | 1.98 Amount | 1 |
| 1QFY-2027 | — | -141,044.61bn Amount | — | — | 317,665.26bn Amount | — | 1.90 Amount | 1 |
| 2QFY-2027 | -22,000.00bn Amount | 41,125.33bn Amount | 307,483.04bn Amount | 527,113.78bn Amount | 315,661.70bn Amount | 1,464,204.93bn Amount | 1.79 Amount | 1 |
| 3QFY-2027 | -22,000.00bn Amount | 7,656.63bn Amount | 302,610.64bn Amount | 518,761.09bn Amount | 305,046.84bn Amount | 1,441,003.03bn Amount | 1.76 Amount | 1 |
181 stale period values omitted; 11 line items fully removed.
Source: S&P Capital IQ transcripts via Xpressfeed · latest indexed call 2026-05-07 · generated 2026-07-19.
Latest call digest
Maximus, Inc., Q2 2026 Earnings Call, May 07, 2026 · 2026-05-07T13:00:00
Q2 FY2026 call — May 7, 2026. Revenue of $1.31 billion landed in line with plan, with adjusted EBITDA margin of 14.4% and adjusted EPS of $2.07. Two unusual items — a $6.9 million ($0.09) software-asset impairment in U.S. Services and a $4.2 million (~$0.08) discrete R&D tax benefit — effectively offset in adjusted EPS. Management raised the FY2026 adjusted EPS guide for the second consecutive quarter to $8.25–$8.55 (up $0.20), lifted the full-year EBITDA margin guide to ~14.2%, and reiterated revenue of $5.2–$5.35 billion and free cash flow of $450–$500 million. It also raised its near-term EBITDA margin target range to 12%–15% and refreshed a $400 million buyback (≈$111 million repurchased in the quarter, $40 million more after quarter-end). Prepared remarks leaned on technology/AI-driven federal margin gains, fraud/program-integrity positioning, and building HR-1 (Medicaid work-requirement/SNAP) state opportunities, with one arrangement estimated to lift current program revenue by more than 30% and U.S. Services expected to return to mid-single-digit organic growth by Q4.
The Q&A was thin — a single analyst (CJS Securities) — and pressed the softer spots the prepared remarks skated over: an elevated 78-day DSO driven by administrative delays at one major federal customer and its effect on buyback capacity; why federal tech-efficiency gains have not yet reached the U.S. Services margin; the drivers of first-half state revenue declines against the promised Q4 recovery; and the still-undefined VA veterans-exam recompete timeline (contract runs to December 31, 2026, with an Industry Day pending).
Participant coverage from the latest call.
| Group | Participants | Count |
|---|---|---|
| Management | Operator; James Francis — Vice President of Investor Relations, Maximus, Inc.; David Mutryn — CFO & Treasurer, Maximus, Inc.; Bruce L. Caswell — President, CEO & Director, Maximus, Inc. | 4 |
| Analysts | Will Gildea — Equity Research Associate, CJS Securities, Inc. | 1 |
Curated latest-call exchanges; one row per analyst topic.
| Analyst | Firm | Topic | What changed in Q&A |
|---|---|---|---|
| Will Gildea | CJS Securities, Inc. | Elevated DSO and buyback capacity | Pressed on the higher DSO and repurchase capacity given cash lumpiness; management attributed it to one major federal customer with complex, retroactive invoicing and expects collections to catch up in Q4. |
| Will Gildea | CJS Securities, Inc. | HR-1 / SNAP offerings | Asked whether other SNAP solutions are being brought to market; management centered on the Accuracy Assistant tool plus wrapped BPO services and the Medicaid community-engagement (work-requirement) tool. |
| Will Gildea | CJS Securities, Inc. | State revenue decline vs. Q4 recovery | Asked what drove first-half U.S. Services declines and the basis for Q4 growth confidence; management cited prior-year clinical volumes and state-specific dynamics, with HR-1 activity underpinning the Q4 turn. |
| Will Gildea | CJS Securities, Inc. | Federal vs. Services margin gap | Asked why efficiency gains lifting U.S. Federal have not yet reached U.S. Services; management cited larger federal contract scale, state caution on AI adoption, patchwork state regulation, and legacy-system integration. |
| Will Gildea | CJS Securities, Inc. | VA recompete | Asked about VA contract timing, a possible extension, and an upcoming Industry Day; management said no formal rebid timeline has been released and the current contract runs through December 31, 2026. |
| Will Gildea | CJS Securities, Inc. | Remaining federal tough comps | Asked about further tough federal comparables in the back half; management flagged the prior-year fiscal Q3 clinical-volume surge as a continued tough comp. |
Theme tracker
Themes are curator-classified across supplied calls.
| Theme | Status | Quarters mentioned | Read-through |
|---|---|---|---|
| HR-1 / Medicaid work requirements & SNAP state opportunity | emerged | Q3 2025, Q4 2025, Q1 2026, Q2 2026 | Surfaced as the "Big Beautiful Bill" in August 2025 and has become the central state-side growth catalyst; management frames FY2026 as a shaping year with revenue contribution expected in FY2027 as final regulations solidify. |
| AI and automation as a margin lever | persisted | Q1 2025, Q3 2025, Q4 2025, Q1 2026, Q2 2026 | A recurring and increasingly emphasized driver of U.S. Federal margin expansion; management ties it to decoupling labor from volume and, in Q2 2026, raised the near-term margin target on this basis. |
| VA / veterans-exam recompete (PACT Act, MDE volumes) | persisted | Q4 2023, Q1 2024, Q2 2024, Q3 2024, Q1 2025, Q3 2025, Q1 2026, Q2 2026 | The most consistently pressed topic; the current contract runs to December 31, 2026 and the recompete timeline remains undefined, leaving a large federal program as an open question. |
| Medicaid redeterminations / unwinding tailwind | dropped | Q3 2023, Q4 2023, Q1 2024, Q2 2024, Q3 2024, Q1 2025 | The dominant FY2024 U.S. Services tailwind; management says the effort was complete by FY2025, and it is now absent as a driver and instead a year-over-year comp headwind. |
| Capital deployment — buybacks and disciplined M&A | persisted | Q4 2024, Q4 2025, Q1 2026, Q2 2026 | Repurchases stepped up as management calls the shares undervalued, alongside a stated bias toward federal defense / national-security acquisitions, all within a 2x–3x leverage target. |
Guidance ledger
Quotes, calls, and speakers are source-verified; outcomes are curator-classified.
| Verbatim guidance | Call | Speaker | Curator outcome | Outcome note |
|---|---|---|---|---|
| “adjusted EPS is projected to be between $5.70 and $6 per share” | Maximus, Inc., 2024 Earnings Call, Nov 21, 2024 · 2024-11-21T14:00:00 | David Mutryn | kept | Initial FY2025 range; raised repeatedly through the year and delivered adjusted EPS of $7.36 for fiscal 2025. |
| “We believe a reasonable range in the near term is 10% to 13% adjusted EBITDA margin.” | Maximus, Inc., 2024 Earnings Call, Nov 21, 2024 · 2024-11-21T14:00:00 | David Mutryn | kept | FY2025 came in at a 12.9% adjusted EBITDA margin, within the range; the target was later raised to 12%–15% in May 2026. |
| “adjusted EPS is projected to be between $7.95 and $8.25 per share” | Maximus, Inc., Q4 2025 Earnings Call, Nov 20, 2025 · 2025-11-20T14:00:00 | David Mutryn | pending | Initial FY2026 guide; subsequently raised to $8.05–$8.35 in February and $8.25–$8.55 in May, with the fiscal year not yet complete. |
| “Free cash flow for fiscal year 2026 is projected to be between $450 million and $500 million.” | Maximus, Inc., Q4 2025 Earnings Call, Nov 20, 2025 · 2025-11-20T14:00:00 | David Mutryn | pending | Reiterated on both the Q1 and Q2 FY2026 calls; delivery hinges on DSO normalizing below 70 days by year-end. |
| “Our adjusted EPS guidance increases by $0.10 and is now expected to range between $8.05 and $8.35 per share.” | Maximus, Inc., Q1 2026 Earnings Call, Feb 05, 2026 · 2026-02-05T14:00:00 | David Mutryn | pending | First FY2026 raise; increased again to $8.25–$8.55 in May 2026. |
| “Our adjusted EPS guidance increases by $0.20 and is now expected to range between $8.25 and $8.55 per share.” | Maximus, Inc., Q2 2026 Earnings Call, May 07, 2026 · 2026-05-07T13:00:00 | David Mutryn | pending | Second consecutive raise; fiscal year ends September 30, 2026. |
Q&A pressure map
Question counts and firms are curator tallies; analyst coverage shown above.
| Topic | Questions | Firms | Pressure / response |
|---|---|---|---|
| VA / veterans-exam contract and recompete | 15 | CJS Securities, Inc., Raymond James & Associates, Inc., Research Division, Stifel, Nicolaus & Company, Incorporated, Research Division | Pressed in nearly every call across all three brokers, most recently on rebid timing and a possible extension; management has consistently declined to give a firm recompete timeline. |
| Margin durability and technology-driven efficiency | 12 | CJS Securities, Inc., Raymond James & Associates, Inc., Research Division, Stifel, Nicolaus & Company, Incorporated, Research Division | Recurring probing on how sustainable the margin gains are and why they show up in Federal but not yet in U.S. Services. |
| Medicaid redeterminations / unwinding | 9 | Stifel, Nicolaus & Company, Incorporated, Research Division, Raymond James & Associates, Inc., Research Division, CJS Securities, Inc. | Heavily pressed through FY2024 as analysts sized the tailwind and its wind-down; faded as the exercise completed. |
| HR-1 / Big Beautiful Bill / SNAP opportunity sizing | 5 | CJS Securities, Inc., Raymond James & Associates, Inc., Research Division | Repeated attempts to quantify the state opportunity; management has kept answers qualitative on scope and timing, pointing to FY2027 for revenue. |
| Cash flow, DSO and buyback capacity | 4 | CJS Securities, Inc., Raymond James & Associates, Inc., Research Division, Stifel, Nicolaus & Company, Incorporated, Research Division | Pressed on free-cash-flow rhythm and, more recently, elevated DSO and its constraint on repurchases; management ties the drag to one federal customer. |
Language shifts
Only language evidence verified against the referenced component is shown.
| Observation | Verbatim evidence | Call ID | Component |
|---|---|---|---|
| Management lifted its near-term margin ceiling, signaling greater confidence in the durability of technology-driven gains versus the 10%–13% target set the prior year. | “we are raising our near-term adjusted EBITDA margin target range to 12% to 15%” | 1994106528 | 2 |
| New procurement-risk vocabulary entered the prepared remarks, flagging slower federal awards and rising protests as a timing headwind. | “awards have shifted right, protests have increased, further delaying outcomes” | 1994106528 | 3 |
| Cash-collection caution became a repeated theme, with elevated DSO tied to a single federal customer rather than broad demand. | “ongoing administrative delays at a major federal customer” | 1994106528 | 2 |
The call history shows a management team that has repeatedly raised earnings guidance on technology-driven margin gains while the top line laps its own FY2024–FY2025 volume surges. For the current debate, the swing factors are the unresolved VA recompete and whether the HR-1 / SNAP state pipeline converts into the FY2027 revenue management keeps promising.
The company in one look
Maximus runs the administrative machinery behind government benefit programs. It answers the Medicare help line, verifies Medicaid eligibility for states, examines veterans' disability claims, and operates welfare-to-work programs — work that generated $5.43 billion of revenue in fiscal 2025 [1], essentially all of it from government customers [2]. The stock has fallen from roughly $99 in January 2026 to $58, and now trades at about 7 times guided earnings and a 12% free-cash-flow yield. This report tests whether that cash flow is durable.
Revenue FY2025 ($M)
Adj. EBITDA Margin
Free Cash Flow FY2025 ($M)
FCF Yield (trailing)
Sources: FY2025 Form 10-K — revenue [3], Adjusted EBITDA margin [4], free cash flow [5]; FCF yield derived on a $3.06B market capitalization (52.5M shares at $58.30).
What Maximus does
Maximus was founded in Virginia in 1975 and describes itself as a provider of tech-enabled services to government, touching more than 100 million American citizens plus programs in the U.K., Canada, and the Middle East [6]. Its role is narrow and specific: it translates public policy into operating models — call centers, eligibility systems, clinical assessment networks — that deliver a government program at scale, for a fee. It does not set policy or fund the benefits; it runs the delivery.
The business reports in three segments. U.S. Federal Services, the largest and most profitable, runs federal contact centers and clinical-assessment work, including the Veterans Evaluation Services network. U.S. Services administers state health-and-human-services programs — Medicaid enrollment, child support, employment services. Outside the U.S. is a smaller employment-and-health-services operation concentrated in the U.K.
Source: FY2025 Form 10-K, Note 3 Business Segments [7].
The concentration is the defining feature. In fiscal 2025, about 55% of revenue came from the U.S. federal government and about 33% from state and local agencies — roughly 88% from government, with most of the rest from national governments abroad [8]. It is concentrated further within that: roughly 60% of revenue came from the ten largest contracts, and about one-fifth from a single federal agency [9]. This is a company whose fortunes are tied to a small number of government relationships.
How it gets paid matters for the cash-flow question. About 54% of revenue is performance-based — paid per transaction or per outcome, such as a completed medical exam or a sustained job placement — and 13% is fixed-price; the balance is cost-plus and time-and-materials work [10]. Performance-based contracts carry estimation risk but tend to scale with citizen activity rather than headcount, which is central to the margin story developing now.
Scale and trajectory
Revenue has grown from about $2.45 billion in fiscal 2017 to $5.43 billion in fiscal 2025 — roughly a 10% annual rate over eight years, and a 9.4% five-year compound rate [11]. Two acquisitions in 2021 — the Veterans Evaluation Services and federal-technology businesses — roughly doubled the goodwill on the balance sheet and lifted federal exposure. Operating cash flow has been positive every year but lumpy, ranging from $245 million to $517 million over the period, a pattern the reader focused on cash-flow consistency will want to test.
Source: FY2025 Form 10-K, Consolidated Statements of Operations and Cash Flows; prior-year figures per company filings, as reported [12].
Contracted backlog stood at $15.3 billion at September 30, 2025 — about 2.8 times annual revenue — which gives the top line reasonable forward visibility, though the company cautions it may not realize all of it [13].
The economics
This is an asset-light services model. Capital expenditure was $63 million in fiscal 2025 against $429 million of operating cash flow, so free cash flow was $366 million; the prior year converted $515 million of operating cash flow into $401 million of free cash flow [14]. Operating margin was 9.7% [15] and Adjusted EBITDA margin 12.9%; on an adjusted basis that excludes acquisition intangible amortization, diluted earnings were $7.36 per share versus $5.51 reported [16].
The recent operating story is margin, not growth. Management credits automation and AI tools that "decouple labor costs from our ability to process more volumes" — the same forces that let a per-transaction contract earn more without adding people [17] — and on that basis has guided the federal segment to a 17.5% full-year operating margin and raised its near-term Adjusted EBITDA margin target to 12–15% [18]. Against that, revenue is guided to be roughly flat-to-down in fiscal 2026 at $5.2–5.35 billion as elevated pandemic-era and natural-disaster volumes roll off; adjusted EPS is guided to $8.05–8.55, up about 14%, and free cash flow to $450–500 million [19]. Earnings and cash are being guided higher even as the top line pauses.
Balance sheet and capital return
Maximus carries net debt — about $1.4 billion at March 31, 2026 against $157 million of cash — but leverage is moderate at 1.75 times EBITDA on the credit-agreement definition, inside its own 2–3x target [20]. Because goodwill and intangibles (about $2.3 billion) exceed book equity ($1.7 billion), tangible book value is negative — normal for an acquisitive services business, but a reason tangible price-to-book is not a useful anchor here [21].
Capital return has stepped up sharply. In fiscal 2025 the company repurchased 5.8 million shares for $462 million [22], and it kept buying into the 2026 decline, authorizing a fresh $400 million program in May 2026 while stating it prioritizes repurchases "when we believe our share price does not reflect the intrinsic value of the business" [23]. Shares outstanding have fallen from 60.4 million in September 2024 to 52.5 million by May 2026, a 13% reduction, alongside a $1.20 dividend [24].
Sources: FY2025 Form 10-K, Statements of Changes in Shareholders Equity [25]; Q2 FY2026 Form 10-Q cover, 52,540,363 shares outstanding as of May 4, 2026 [26].
The stock and what the price implies
The share price roughly doubled from late 2023 to an all-time high near $99 in January 2026, then fell about 41% to $58 by July 2026 — the drop coinciding with fiscal-2026 guidance for flat-to-lower revenue and a working-capital build that pushed days-sales-outstanding to 78 days at a large federal customer [27], with the veterans-exam contract — the anchor of the 2021 acquisition — running through December 2026 and due for recompete [28]. An earlier, smaller drawdown in early 2025 followed the launch of the federal Department of Government Efficiency (DOGE), whose stated goal of cutting federal spending is a direct risk to a contractor that draws most of its revenue from Washington [29].
Source: market price data, as reported; period-end and 52-week-high closing prices.
What the reader gets at $58 is a specific arithmetic. On a $3.06 billion market capitalization, trailing free cash flow of $366 million is a 12.0% yield, and the $450–500 million guided for fiscal 2026 would be roughly 15%. Enterprise value of about $4.4 billion is 6.3 times fiscal-2025 Adjusted EBITDA, and the price is near 7 times the midpoint of guided adjusted EPS — with the share count still shrinking.
Source: derived from FY2025 Form 10-K figures [30] [31], FY2026 guidance [32], and market price; leverage per the Q2 FY2026 10-Q [33].
Multiples this low usually price a business the market believes is about to shrink. The bull case is that the fear is misplaced: much of Maximus's work runs mandatory programs — Medicare, Medicaid, veterans' benefits — that persist across administrations, and its state contracts are paid by citizen activity, so tighter eligibility rules can raise transaction volumes even as they cut the benefit rolls [34]. The bear case is equally concrete: 60% of revenue sits in ten contracts, one-fifth in a single agency, the largest of those faces recompete, and DOGE is an explicit effort to spend less on exactly this kind of vendor.
What this report tests
The reader's standard is a durable moat that keeps free cash flow strong — even if it stops growing — for at least a decade. Maximus arrives with the cash-flow economics that standard rewards: a 12% trailing free-cash-flow yield, 1.75x leverage, and a shrinking share count, all after a selloff that halved the equity while management guided cash flow higher. Durability is the open question, and it runs through every chapter that follows:
Is Maximus's incumbency in administering mandatory U.S. government benefit programs a durable enough franchise to keep free cash flow consistent, and probably higher, a decade from now — or is the market right that federal budget-cutting and the recompete of concentrated, essential contracts will steadily erode a business that depends entirely on government spending?
Answering it means testing four things in turn: how consistent the cash flow actually is beneath the lumpy headline; whether incumbency in these programs is a real switching-cost moat or just a recurring bid; what the DOGE-era policy shift does to demand; and what the depressed price is discounting relative to a defensible estimate of long-run cash generation.
Recompete Durability
Maximus owns no contracts outright. Every dollar of revenue sits inside a government agreement that runs for a fixed term and is then reopened to competitors, so the franchise is a retention business, not a set of annuities. The evidence supports a durable, retention-based moat: management models — and has held for five years — a rebid win rate near 90% plus or minus three points [1], the work is anchored to mandatory entitlement programs that survive administrations, and the contracting model gains volume when eligibility rules tighten [2]. The binding constraints are concentration and the veterans-exam contract that closes at the end of December 2026 [3].
Modeled rebid win rate
Revenue in 10 largest contracts
Revenue from one federal agency
FY2025 DOGE revenue impact ($M)
Sources: rebid win rate [4]; concentration [5]; DOGE impact [6].
The moat is retention, not lock-in
Maximus's contracts run for a fixed number of years, may be extended if the agency elects to, and are then opened to competing bidders with no guarantee of renewal [7]. Almost all of them also carry a "termination for convenience" clause that lets the customer end the work at any time [8]. There is no contractual monopoly here; the advantages the company itself lists are experience-based — decades of program-operations expertise, the ability to convert program rules into compliant technology, financial strength, and a familiarity with government bidding "which can be difficult for new or inexperienced competitors" [9].
What turns that into a moat is the win rate on rebids. Management describes the target as a 90% plus-or-minus-three rebid win rate, notes it "has been the case over the last five years," and reports it holding "at historic levels near 90%" through the FY2024 slow patch [10] [11]. An incumbent that keeps roughly nine of ten recompetes it defends compounds an installed base rather than treading water — and the switching cost a customer bears is real: in one state, Maximus staff are trained across five separate legacy systems to deliver a single program, the kind of integration a challenger cannot replicate on a bid timeline [12].
The metric investors watch for renewal health — book-to-bill — is deceptively noisy, and the noise is the first thing to understand about this business. Signings cluster in whatever year the large multi-year contracts happen to come up for rebid, so book-to-bill swings widely without the underlying franchise changing. Four quarters in FY2022–FY2023 ran above 2.0x on a wave of rebids; FY2024 then fell to 0.4x because so little was up for renewal, before recovering toward 0.9x in FY2025 [13] [14].
Sources: TTM book-to-bill at each period end — Sep-2023 1.2x [15]; Sep-2024 0.4x [16]; Mar-2025 0.8x [17]; Sep-2025 0.9x [18].
A book-to-bill below 1.0x for two straight years is not, in this case, a signal that the franchise is shrinking; a normal year with rebids evenly distributed would produce close to 1.0x from renewals alone, and the low readings coincide with a thin rebid calendar rather than lost work [19]. The genuine caution is that this same lumpiness front-loads risk: the years with the heaviest rebid volume are the years the win rate matters most, and the next such year is now approaching.
Why the programs themselves persist
Retention only matters if the underlying programs keep running, and Maximus's portfolio is deliberately built around work that does. Its largest lines administer Medicaid eligibility, Medicare and Affordable Care Act enrollment, and veterans' disability benefits — mandatory-spending entitlement programs with bipartisan support that "stand the test of various presidential administrations" [20]. A significant majority of the work is classified "essential" by the government, so it continues even through a federal shutdown [21].
The more important structural feature is how Maximus is paid. Most state Medicaid contracts pay for the volume of activity performed — eligibility checks, redeterminations, enrollments — not a flat fee per enrolled member. That inverts the usual political risk: a policy that cuts the number of recipients does not necessarily cut Maximus's volume, because verifying who still qualifies is itself billable activity [22]. The 2025 One Big Beautiful Bill Act sharpens that dynamic. It raises the redetermination frequency for the Medicaid adult-expansion population from annual to every six months and adds an 80-hour monthly work-and-community-engagement requirement, both effective December 31, 2026 — and it explicitly bars health insurers from administering the engagement requirement on behalf of states, leaving the work to third-party operators [23]. It is a plausible FY2027-and-beyond volume tailwind, though the same filing cautions that states may request delays of up to two years and that final rules are still pending [24].
The DOGE stress test
The 2025 federal efficiency drive was the sharpest real-world test of this moat, because it hit the whole government-services sector at once. Maximus's measured exposure was small: management put the direct impact of Department of Government Efficiency actions at roughly $4 million of FY2025 revenue — a rounding error on a base above $5 billion — confined to a handful of small contracts, some already scheduled to end [25].
The contrast with a same-sector peer is the cleanest evidence that the insulation is structural, not luck. ICF International — screened as a Maximus peer but running a discretionary advisory, IT-modernization, and consulting model rather than mandatory-benefit operations — disclosed that it "received contract terminations and temporary stop-work orders" from DOGE in early 2025, and its share of revenue from the U.S. federal government fell from 54% to 43% in a single year [26]. Discretionary consulting was cuttable; running the eligibility engine for a mandatory program was not.
Sources: Maximus federal revenue ~55% and ~$4M DOGE impact (0.07% of revenue) [27] [28]; ICF federal revenue 54%→43% (an ~11-point / ~20% relative decline) [29].
The same episode also exposed the moat's vulnerability, and the clearest case study is the CMS contact-center contract — the 1-800-Medicare and federal-marketplace operation Maximus has run since 2018, worth about $6.6 billion over its full option life and roughly $600–700 million of annual revenue, under 15% of the company [30]. In 2024, CMS moved to recompete it early, attaching a labor-harmony requirement Maximus argued was unprecedented for a services contract of this kind. Maximus contested the move at the Government Accountability Office and then the Court of Federal Claims; after the election, the government canceled the procurement, and the existing contract is now expected to run through 2031 on its option periods [31]. The outcome protected a fifth of federal revenue — but it turned on a legal fight and a change of administration, not on incumbency alone. A recompete can be used as a policy lever, and the defense is not automatic.
Concentration and the December 2026 recompete
The reason these single events matter is concentration. About 60% of revenue comes from the ten largest contracts, and roughly one-fifth from contracts with a single federal agency [32]. With the CMS contact center resolved and the VA medical-disability-exam successor contracts reawarded from January 2025 [33], the largest identified recompete now sits ahead: the veterans-exam work — anchor of the 2021 Veterans Evaluation Services acquisition — runs through December 31, 2026 for all vendors, and the VA has not yet published a rebid timeline. Management calls everything else "normal recompete cadence" [34].
Maximus enters that contest as a strong incumbent — it staffs the work substantially with veterans, has invested in AI to cut case-preparation time, and expresses optimism about the outcome — but "optimism" is not a 90% win rate on a specific, large, single award, and the company concedes it cannot yet say whether the VA will extend the contract while it recompetes [35]. This is the identifiable event most capable of dislodging the durability thesis in the next two years, and it is worth watching for a disclosed timeline and any bridge-contract extension.
Revenue a decade out
For a reader whose test is whether cash flows still stand a decade out, the durability question comes down to whether revenue will be higher in year ten than today. The historical base rate is encouraging — revenue has risen from about $2.45 billion in FY2017 to $5.43 billion in FY2025, roughly doubling across two administrations and a pandemic, with only one modest down-year in FY2018 [36]. The near-term reads flatter: FY2026 revenue is guided to $5.2–5.35 billion, level-to-slightly-below FY2025, even as adjusted EPS is guided up 14% on margin gains [37].
Source: derived from reported financials, FY2017–FY2025 10-Ks (FY2025 revenue $5,431.3M on the Consolidated Statements of Operations [38]); FY2026E is the midpoint of management guidance [39].
The weight of the evidence points to revenue being higher in a decade than today: the programs are mandatory and bipartisan, the activity-based model turns eligibility tightening into volume, OBBBA adds work from FY2027, and a ~90% rebid win rate compounds the base. The strongest facts against that read are the FY2026 flat-to-down guide, the concentration of a fifth of revenue in one agency, and the reminder — from the CMS episode — that a determined customer can force a recompete and win it takes a fight. What would change the read: the veterans-exam recompete lost or materially de-scoped, the rebid win rate slipping below the high-80s for more than one cycle, or a structural shift from activity-based to per-member pricing that removes the volume hedge. On the durability at the center of the investment question, the moat is real and measured, but it is a retention moat that has to be re-won on schedule — not an annuity.
Watch item: the U.S. Department of Veterans Affairs' rebid timeline for the medical-disability-exam contract (current term ends December 31, 2026), and whether Maximus receives a bridge extension. It is the single largest identified recompete and the clearest test of the 90% win-rate record on a concentrated, high-value award.
Cash Conversion
Over a full cycle Maximus turns accounting profit into cash and spends little to do it: operating cash flow has run about 1.5x net income since fiscal 2020, and free cash flow about 1.3x, on capital spending of roughly 1–2% of revenue. But "non-wavering" overstates it. Annual free cash flow has swung between $204M and $481M, the reported year-end collection metric and the trailing cash figure now lean on a receivables facility drawn near its raised $350M ceiling, and fiscal-2026 guidance rests on a large federal collection landing in the September quarter.
The durability case rests as much on whether this revenue reliably becomes cash as on whether the contracts renew.
Earnings do convert to cash — over a full year
Across fiscal 2020–2025, every dollar of net income arrived as more than a dollar of operating cash flow. The addbacks are real and recurring — depreciation plus amortization of acquired intangibles runs roughly $135M a year — and because the work is people-and-software rather than plant, capital spending is light: $63M in fiscal 2025, about 1.2% of revenue [1]. The result is a business whose reported free cash flow has exceeded net income in five of the last six years.
Source: FY2025 10-K Free Cash Flow reconciliation [2]; FY2021 10-K [3]; FY2022 10-K [4]; FY2023 10-K [5].
Operating CF / Net Income (6-yr)
Free CF / Net Income (6-yr)
Capex / Revenue (FY2025)
Source: derived from reported cash-flow and income statements, FY2020–FY2025 10-Ks [6].
On the accrual test the picture is reassuring: over six years cumulative operating cash flow of $2.31B against $1.50B of net income is not the signature of earnings unsupported by cash. Where the reader's concern is warranted is not whether the profit is real, but when the cash shows up — and, increasingly, what helps it show up on time.
The lumpiness is intra-year, and it is large
Maximus runs a September fiscal year, and its government customers pay on their own calendar. The annual number smooths over quarterly swings that are anything but smooth. In fiscal 2025 operating cash flow ran negative through the first three quarters — a net outflow of $183M in the June quarter alone — before a large fourth-quarter recovery took the full year to $429M as delayed collections landed [7] [8]. Fiscal 2026 opened the same way: a $244M outflow in the December quarter, partly recovered to a $190M inflow in March, leaving first-half free cash flow at negative $72M [9].
Source: derived from reported quarterly and annual Consolidated Statements of Cash Flows, FY2024 10-K through Q2 FY2026 10-Q [10] [11].
A fiscal-year-end collection cycle explains most of it. The fourth quarter is when Maximus catches up, and the annual figure it books is genuinely positive and large. But it means the full-year cash number is decided in a single quarter, and any slippage in year-end collections lands directly on the reported figure — a point management itself makes each year [12].
The receivables facility is doing more work than the headline DSO shows
Maximus reports Days Sales Outstanding using billed and unbilled receivables over revenue per day. On that measure fiscal 2025 ended at a steady-looking 62 days, up one day from 61 [13]. That steadiness is partly engineered. Under a Receivables Purchase Agreement with Wells Fargo — expanded during fiscal 2026 from a $250M ceiling to $350M — Maximus sells U.S.-originated receivables for cash, removing them from the balance sheet [14]. Management discloses the effect directly: excluding the facility, DSO would have been 73 days at September 30, 2025 rather than 62, and 102 days at March 31, 2026 rather than the reported 78 [15].
Source: Q2 FY2026 10-Q, Liquidity and Capital Resources [16].
Translated into dollars, the March-2026 gap of 24 days on quarterly revenue implies roughly $340M of receivables sold and off the balance sheet — essentially the full raised $350M capacity. In other words, the facility was drawn near its old $250M ceiling, and the ceiling was lifted to $350M to keep absorbing the same collection delay. That accelerates cash into reported operating flow and holds down reported DSO, and management frames it plainly as "a helpful and low-cost tool to help manage short-term liquidity needs" [17].
The underlying cause is a single relationship. Reported DSO peaked at 96 days in the June 2025 quarter — well above the historical low-60s range — driven by two programs: a major federal program on which Maximus collected more than $300M the following month, and a state program where a delayed contract extension moved $224M from unbilled to billed receivables once signed [18] [19]. The state issue cleared. The federal one did not: the same customer drove DSO back to 78 days through the first half of fiscal 2026, on a program management describes as having "extremely complex and data-intensive invoicing requirements," many of them retroactive and requiring rework of prior-period invoices [20].
Two things temper the concern. The receivables are owed by U.S. government agencies under funded contracts, so this is slow payment, not doubtful payment — the allowance for credit losses, though doubled year-on-year, is $9.8M against roughly $908M of gross receivables, near 1% [21]. And Maximus discloses the facility's DSO impact rather than burying it. The honest read is that reported cash conversion is real but flattered: the year-end DSO that looks stable owes about 11 of its days to the facility, and the trailing free cash flow the market capitalizes is accelerated by it.
Watch item: excluding the receivables facility, DSO rose from 73 days at September 30, 2025 to 102 days at March 31, 2026, with the facility drawn near its raised $350M ceiling. Fiscal-2026 free cash flow guidance of $450–500M requires collecting the delayed federal balance in the September quarter.
What the guidance requires
Management reiterated fiscal-2026 free cash flow guidance of $450–500M, above the $366M booked in fiscal 2025, built on operating cash flow of $485–535M less about $35M of capital spending [22]. With first-half free cash flow at negative $72M, the full year implies more than $520M in the second half, concentrated as usual in the September quarter, and hinges on DSO finishing the year below 70 days as the federal invoices are collected [23]. This is the same shape as fiscal 2025, which also ran negative through mid-year before a large Q4 recovery — the mechanism has worked each year, but it is a collection-timing bet, not an annuity.
The balance-sheet questions a cash-focused reader asks
Several items the reader flagged resolve cleanly, and are worth stating so they can be set aside.
Deferred revenue is small and shrinking — not a growth signal, and not debt. Total deferred revenue was $97.5M at September 30, 2025 (current plus non-current), about 6.6 days of revenue, and it fell to $75.6M by March 2026 [24]. Well under the 30-day threshold that would mark customer prepayments as a demand tailwind, it mostly reflects amounts billed ahead of performance and recognized as revenue as the work is delivered [25]. Net debt is calculated the conventional way — interest-bearing debt of $1.33B less cash of $222M, near $1.11B — and this contract liability is not treated as debt; given its size and the fact that it is discharged by performing services rather than paying cash, that is the right treatment.
Payables show no stretching. Accounts payable and accrued liabilities were $296.9M at year-end, down from $303.3M, and accrued compensation was flat — days-payable near 26 with no rise that would flag cash being conserved by slow-paying suppliers [26]. There is no inventory in a services model, so a days-inventory trend does not apply; the working-capital story is entirely receivables, covered above.
Debt is termed out, with covenant room to spare. The principal facilities are a Term Loan A of $853M maturing May 2029 and a Term Loan B of $494M maturing May 2031, alongside a $750M revolving credit facility [27], at a blended effective rate near 5.4% with roughly half the balance hedged [28]. Scheduled amortization is modest until a $667M Term Loan A maturity in fiscal 2029 — the one real refinancing point, three years out [29]. Net leverage of 1.8x sits well below the 4.0x maximum-leverage covenant [30], so the year-end borrowings that fund the DSO gap are a liquidity-management matter, not a solvency one [31].
Tangible book value is negative — the balance sheet holds no asset backing. Equity of $1.67B sits beneath $1.78B of goodwill and $0.54B of intangibles, leaving tangible book near negative $650M [32]. Tangible price-to-book is therefore not a usable gauge here. That is characteristic of an acquisition-built services roll-up — the value is in contracts and people, not property — but a reader who anchors on asset coverage should register that there is none.
One accounting flag is worth naming and sizing. Maximus took a $6.9M non-cash impairment of capitalized software in the second quarter of fiscal 2026 after a client decision left the asset unrecoverable [33]. It is specific and small — under 1% of adjusted EBITDA — and does not carry the marks of a big-bath write-off; the remaining $32.9M of software tied to those new U.S. Services offerings is the balance to keep an eye on.
The read
Cash conversion is genuinely strong over a full cycle and cheap to sustain: operating cash flow near 1.5x net income, free cash flow near 1.3x, capital spending around 1% of revenue, and no sign that reported earnings are unsupported by cash. "Consistent" is fair; "non-wavering" is not. Annual free cash flow has ranged from $204M to $481M, the reported figure is now accelerated by a receivables facility drawn close to its raised ceiling, and each year's number is decided by whether the September-quarter collections arrive. The strongest fact on the other side is that the delay is a paperwork problem at a funded federal customer, not a credit problem, and management surfaces the facility's effect rather than hiding it. What would change the read: if fiscal-2026 free cash flow lands in the $450–500M range with year-end DSO back below 70 days and facility usage easing, the wavering is timing and the franchise converts; if DSO stays near 78, the facility stays pinned at $350M, and the year-end catch-up slips, then the reported cash generation has been leaning on an accelerant, and the underlying trend is the one shown ex-facility.
Operating Leverage
Maximus is earning more on roughly flat revenue. The adjusted EBITDA margin has climbed from 11.6% in fiscal 2024 to a guided 14.2% for fiscal 2026, and adjusted earnings per share from $6.11 to a guided $8.05–$8.55 [1][2]. Almost all of that lift comes from one segment — U.S. Federal Services — where automation is holding margins up even as a pandemic-and-disaster volume bulge fades. The gain looks mostly structural, but it sits inside the same work facing recompete.
Earnings without the revenue
The revenue line has stalled. Fiscal 2025 revenue of $5.43 billion is guided down to a $5.325 billion midpoint for fiscal 2026 — management removed roughly three points of non-recurring volume and disaster work, offset by about one point of organic growth [3][4]. Yet adjusted earnings keep rising. Adjusted EPS grew 20% in fiscal 2025 to $7.36, and management guides to $8.05–$8.55 for fiscal 2026 — framed as 14% growth at the midpoint [5][6].
Adj. EBITDA Margin (FY2026e)
Adj. EPS (FY2026e midpoint)
U.S. Federal Op. Margin (Q2 FY2026)
Sources: FY2026 adjusted EBITDA margin and adjusted EPS guidance, Q2 FY2026 earnings call [7]; U.S. Federal Services second-quarter operating margin, Q2 FY2026 results release [8]. FY2026 figures are the midpoint of company guidance.
The three-year picture makes the divergence plain: revenue essentially flat, margin and earnings stepping up each year.
Sources: fiscal 2024–2025 actuals and fiscal 2026 guidance, Q4 FY2025 and Q2 FY2026 earnings calls [9][10]. Revenue and adjusted EPS for FY2026e are guidance midpoints.
Margin is the primary lever, but not the only one. Two others sit below the operating line and both push the same way: deleveraging trims interest expense — management sized the year-over-year benefit at roughly $20–$25 million, about $0.30 of EPS [11] — and a shrinking share count lowers the denominator (the Capital Allocation chapter covers the buyback that drives it). Underneath all of it, though, the margin is the main driver.
One segment does the lifting
Maximus reports three segments, and the margin story is almost entirely one of them. U.S. Federal Services — 56% of revenue — carried its operating margin from about 10% through fiscal 2021–2023 to 15.3% in fiscal 2025, then 17.6% in the second quarter of fiscal 2026 [12][13]. Over the same window U.S. Services fell — from 12.9% in fiscal 2024 to 9.7% in fiscal 2025 — and Outside the U.S. hovered near breakeven [14].
Source: segment operating income and revenue, FY2021–FY2025 10-Ks (as reported); FY2026 values are the company's full-year segment margin guidance from the Q2 FY2026 call — U.S. Federal ~17.5%, U.S. Services ~10%, Outside the U.S. ~breakeven [15].
The divergence is sharper against the company's own history. On its fiscal-2023 investor framework, U.S. Federal Services carried a target margin range of 10% to 12% and U.S. Services a post-pandemic range of 11% to 14% [16]. Two years on, Federal runs five points above the top of its old range while Services sits below the bottom of its. Whatever has changed the margin structure has changed it in one place.
Structural gain or cyclical peak
The Federal margin move blends two very different sources, and separating them is what matters most for a reader who needs cash flow higher a decade out.
The cyclical part is real and management flags it plainly. Fiscal 2024 and 2025 carried a bulge of non-recurring volume: FEMA natural-disaster support ("the extent and timing of which are difficult to predict"), a backlog-reduction push by federal customers, and the ramp of medical-assessment volumes tied to the PACT Act [17]. Incremental volume on a largely fixed base lifts margin, and by the fourth quarter of fiscal 2025 those volumes "had settled back to more typical levels" [18]. That bulge is the roughly three points of revenue management is removing from the fiscal 2026 guide.
The structural part is the more interesting claim, and the evidence for it is that margin kept rising as the volume rolled off. In the second quarter of fiscal 2026, Federal revenue excluding disaster work grew just 1.5% organically — yet the segment margin expanded 230 basis points, to 17.6% from 15.3% [19]. Management attributes the improvement to "technology initiatives, including automation that enables greater volume processing without a commensurate increase in labor costs" [20]. The concrete example is the veterans-exam work: case files run 3,000 to 5,000 pages, and Maximus has invested in AI and machine learning to organize heterogeneous medical records and to extract prior results so that some veterans need not be re-examined — cutting labor per exam rather than adding headcount to process more of them [21].
Management has put its guidance behind the durable half of the story twice over. It raised the near-term adjusted EBITDA margin target range from 10%–13% to 12%–15%, saying "much of the improvement has come from technology enhancements and cost actions that we believe have staying power" [22][23]. And through fiscal 2026 it raised the Federal full-year margin guide three times as the non-recurring volumes faded — a pattern hard to explain if the gains were purely cyclical.
Sources: U.S. Federal Services full-year fiscal 2026 operating-margin guidance — 15.5%–16% at Q4 FY2025 [24], 16.5%–17% at Q1 FY2026 [25], ~17.5% at Q2 FY2026 [26]. Bars plotted at range midpoints.
Two caveats keep this from being a clean structural win. First, the automation story has not visibly rescued the other domestic segment: U.S. Services margin fell to 9.7% in fiscal 2025 and is guided only to about 10% for fiscal 2026 — the "decoupling" shows up in Federal, not (yet) across the portfolio [27][28]. Second, management itself keeps the target range wide, warning that "new program ramps and mix can affect margins in any given year" — new work at Maximus typically starts at a lower margin and improves over time [29]. A book of business winning more new awards would dilute today's peak margin before it lifts it.
The margin gain and the recompete are one asset
The uncomfortable overlap is that the source of the margin gain and the largest recompete risk are the same contract. The Federal margin gain is concentrated in clinical and medical-assessment work [30] — the veterans-exam business acquired in 2021, which runs through December 31, 2026 for all vendors before it is rebid (Recompete Durability). The same asset that lifted the adjusted EBITDA margin toward 14% is the one whose forward economics a rebid could reprice.
The margin expansion is narrow. It is concentrated in U.S. Federal Services, and within that segment in the clinical and medical-assessment work that is up for recompete on December 31, 2026. A rebid at lower price, or new-work mix at lower entry margins, would test the durability of the very gain that is driving earnings.
The counter is that the technology gains should travel with the work. The automation is embedded in how the exams are processed, and Maximus commonly continues delivering under bridge or extension arrangements while a rebid is adjudicated — so the productivity is not obviously surrendered the moment a contract term ends. Management also describes the efficiency gains as spanning "multiple program areas," not the veterans-exam contract alone [31]. But the concentration is a fact, and it links the margin gain directly to the recompete calendar.
The read
The weight of the evidence is that most of the fiscal-2024-to-2026 margin gain is durable rather than borrowed. Management raised both the company-wide durable target (to 12%–15%) and the Federal segment guide (15.5%–16% up to ~17.5%) as the non-recurring volumes rolled off — the opposite of what a purely cyclical peak looks like — and the mechanism, automation that cuts labor per unit of work, is specific and demonstrated. A reasonable anchor for the sustainable Federal margin is the mid-to-high teens the company now guides, above the fading 17.6% quarter but well above the 10%–12% it targeted two years ago.
The main risk to that read is concentration, not fabrication: the gain lives in one segment and, within it, in the contract facing recompete. What would confirm the structural case is Federal margin holding at or above 16% through fiscal 2027 on organic volume, with U.S. Services finally clearing 10%–11% as its own technology adoption lands. What would break it is a reversion of Federal toward its old 10%–12% range — most plausibly through a lost or repriced veterans-exam recompete, or a wave of new awards entering at low margin. Both are checkable in the segment tables each quarter.
The one large acquisition
In 2021 Maximus paid about $1.36 billion for VES Group to enter federal clinical assessments, funding it almost entirely with new term debt [1]. Five years on the deal reads as value-accretive: U.S. Federal Services operating income has roughly tripled and its margin has nearly doubled [2]. The return is not secured — $380 million of the acquired intangibles, and the earnings behind them, ride on one VA contract that recompetes December 31, 2026 [3].
This is the one capital decision large enough to have reshaped the company, and no prior chapter has put a return on it. VES built the margin engine examined in Operating Leverage and, in the same stroke, concentrated the risk examined in Recompete Durability. Both sides of the report's central question trace to this transaction.
What was bought, and what was paid
Maximus acquired 100% of VES Group — a leading provider of medical disability examinations for the U.S. Department of Veterans Affairs — on May 28, 2021, for a cash price of $1,364.9 million, net of cash acquired, and folded it into U.S. Federal Services [4]. A second, smaller federal deal closed ten weeks earlier: the federal division of Attain, LLC, for $419.1 million on March 1, 2021 [5]. Together the two absorbed about $1.78 billion of capital in a single year and remade the segment.
Source: FY2021 Annual Report (Form 10-K), Note 6 — VES valuation and intangible asset table [6].
The allocation tells you what Maximus was actually buying. Of the $1.36 billion, $864 million landed in goodwill — the assembled workforce and the VA relationship — and $664 million in identifiable intangibles, of which $580 million was a single line: the customer contracts and relationships with the VA, assigned a 12-year life [7]. Net identifiable assets were only $501 million, and net of the deferred-tax and lease liabilities assumed, tangible assets were slightly negative [8]. Essentially the entire price was paid for a customer relationship and the earnings expected to flow from it.
Against production, that was a full price. In its first partial period — May 29 to September 30, 2021, roughly four months — VES contributed $186.6 million of revenue and $53.5 million of gross profit [9]. Annualized, that is about $545 million of revenue, so Maximus paid roughly 2.5 times sales for a services business — a multiple that only makes sense if the volume grows.
VES Price ($B)
Goodwill + Intangibles
VES Revenue at Close ($M, ann.)
New Term Debt ($B)
Sources: FY2021 Annual Report (Form 10-K), Note 6 [10] and Note 9 debt table [11]. Goodwill-plus-intangibles exceeds 100% of price because assumed net tangible liabilities offset it.
The funding was debt. To close VES, Maximus entered a new credit agreement; by September 30, 2021 total debt principal had gone from $29 million a year earlier to $1,523.5 million — Term Loan A of $1,086 million and Term Loan B of $399 million [12]. The 2021 coupon was low — near-zero LIBOR floors — but that same debt has since been refinanced at the ~5.4% blended rate laid out in Cash Conversion, so the deal's carrying cost rose well after the fact.
The immediate effect on reported earnings was negative. Loading a debt-funded, intangibles-heavy business onto the income statement roughly doubled amortization of intangibles to $90.5 million in fiscal 2022 (from $44.4 million) and roughly tripled interest expense to $46.0 million (from $14.7 million); operating margin fell from 9.6% to 7.0% and net income dropped from $291.2 million to $203.8 million [13]. Net income slid again to $161.8 million in fiscal 2023 and did not clear its pre-deal fiscal-2021 level until fiscal 2024 [14]. Fiscal 2021 carried unusually rich pandemic-response work, so part of that decline was normalization rather than the deal — but the amortization and interest were structural, and a shareholder judging the acquisition in 2023 had watched two straight years of falling earnings after a $1.36 billion outlay. The deal cost earnings before it added them.
The payoff arrived in the segment
VES is not reported as a standalone unit after integration, so a clean deal-level IRR is not computable from the filings; the honest read comes from the segment it was folded into. On that basis the case is straightforward. U.S. Federal Services operating income went from $132.9 million in FY2020 — the last full year before the deals — to $469.2 million in FY2025, and the segment margin climbed from 8.1% to 15.3% [15].
Source: derived from reported segment results, FY2020–FY2025 10-Ks; VES acquired May 2021, Attain March 2021 [16].
The revenue line that VES anchors makes the same point. Clinical Services revenue — VA medical examinations plus state-level assessments — grew from $539 million in FY2020 to $2,101 million in FY2025, close to a fourfold increase, and is now the largest of the four service lines Maximus reports [17]. VES did not merely add scale; it gave the company a federal-level clinical platform it had not previously had, and management points to synergy wins that "neither legacy company could successfully win" alone as the deal's intent "manifesting" [18].
Source: reported disaggregated revenue by service line, FY2020–FY2025 10-Ks [19].
Sizing the return
The segment gained $336 million of annual operating income between FY2020 and FY2025. Not all of that is the two deals — some is organic growth in legacy federal work, and part of the FY2024–FY2025 step-up is the cyclical volume bulge separated out in Operating Leverage. Crediting the acquisitions with the full increase implies a pre-tax return of about 19% on the $1.78 billion deployed; crediting them with only two-thirds of it drops that to roughly 13% pre-tax, or about 10% after Maximus's ~24% tax rate. Either figure clears a mid-single-digit-to-~9% cost of capital, so on the evidence available the 2021 federal M&A program has earned its keep.
One qualifier tempers how much of that return reflects deal-making skill. Much of the volume that lifted clinical revenue came from the PACT Act of August 2022, which expanded the conditions under which veterans qualify for benefits and, in Maximus's own words, "resulted in increases in MDE volumes" it expects to continue [20]. Maximus underwrote the platform; Congress supplied much of the demand fifteen months after the close. The acquisition bought the right asset in the right place, but the size of the payoff owes as much to an exogenous legislative tailwind as to the price paid or the integration.
One accounting wrinkle cuts in the deal's favor and is worth stating plainly. Reported operating income is charged with amortization of the acquired intangibles — $92.0 million across the company in FY2025, worth $1.17 of after-tax diluted EPS, the majority of it VES's $580 million customer-relationship asset [21]. That charge is non-cash: the cash the deal throws off exceeds the GAAP earnings it is credited with, which is why the returns above, struck on reported operating income, understate the cash economics somewhat.
What the return still rides on
The same allocation that made the deal a growth bet makes its durability a recompete bet. At March 31, 2026, $380.4 million of the original VES intangibles remained on the balance sheet — customer relationships and the medical provider network — and Maximus states outright that these assets "continue to support medical disability examinations (MDE) contracts with the U.S. Department of Veterans Affairs," are being amortized over a remaining life of about seven years, and that "in the event that our expectations change with respect to these acquired contracts, the value of these assets and the estimated remaining lives of these assets may need to be adjusted" [22].
That is an impairment warning attached to a single customer. The MDE contract that carries these assets runs through December 31, 2026 for all vendors; the VA has not released a rebid timeline, and management expects to learn one at an upcoming industry day, with a bridge extension possible but not confirmed [23]. The FY2025 10-K makes the exposure concrete at the company level: about one-fifth of revenue comes from a single federal agency, and the loss of a significant contract could bring "impairment charges related to tangible and intangible assets, including goodwill" [24].
Two facts sit on the other side of that risk. Maximus's own history is that recompete losses "typically affected approximately 7% to 10%" of the business a year, "largely being replaced by new or expanded work elsewhere" — a franchise that has absorbed rebids before [25]. And the goodwill itself is not yet in question: the July 1, 2025 annual test concluded it was not more likely than not that any reporting unit's fair value was below its carrying amount, with no impairment recorded [26].
The read
On the record to date, VES was a good use of $1.36 billion: a full entry price, paid almost entirely for a VA customer relationship, that execution has vindicated by turning U.S. Federal Services into the company's earnings engine. The strongest fact against treating that as settled is that $380 million of the acquired intangibles and the record segment margin behind them both rest on the one contract up for rebid on December 31, 2026 — the deal built the margin engine and concentrated the risk in the same asset. What would change the read is the rebid outcome: a clean VES retention converts the acquisition from accretive-so-far to durably accretive; a loss would trigger the intangible impairment management has already flagged and pull the segment margin back toward its pre-deal level. The deal's verdict and the report's central question resolve on the same day.
Non-Federal Segments
Roughly 44% of Maximus's revenue sits outside U.S. Federal Services, in two segments the report has so far treated as a footnote to the Federal margin engine. Both shrank in fiscal 2025, for opposite reasons: management has spent three years divesting the international business down to a smaller, finally-profitable core, while U.S. Services gave back a temporary Medicaid-redetermination volume bulge. The net effect is a portfolio steadily concentrating toward the same federal exposure the thesis worries about.
The other 44%, and what it earns
In fiscal 2025 the two non-Federal segments produced $2.36 billion of revenue — 43.5% of the company's $5.43 billion total — but only $193.7 million of the $662.8 million segment operating income, about 29% [1]. U.S. Federal Services, on 56.5% of revenue, throws off 70.8% of segment profit [2]. Earnings are more concentrated than revenue, and the gap is widening.
Non-Federal Share of Revenue
Non-Federal Share of Segment Op. Income
Outside U.S. Op. Margin FY2025
Source: FY2025 segment results — revenue, segment operating income and margin by segment [3].
The revenue mix has moved steadily toward Federal. Federal Services grew from 49.0% of revenue in fiscal 2023 to 56.5% in fiscal 2025; Outside the U.S. fell from 14.0% to 11.0% over the same window [4]. That shift is not an accident of growth rates — it is partly the result of deliberate decisions in the other two segments.
Sources: FY2023–FY2025 from the FY2025 10-K segment note [5]; FY2022 as reported in prior filings.
Outside the U.S.: a deliberate exit, not a retreat
The international segment has been the company's weakest performer — loss-making as recently as fiscal 2023, at a $9.1 million operating loss on a negative 1.3% margin [6]. Management's response was to sell, not to fix in place. Since early 2023 Maximus has divested businesses across at least seven countries: the U.K. commercial practice and its Swedish subsidiary in March 2023; Italy, Singapore and its Canadian employment-services business in November 2023; and Australia and Korea in December 2024 [7].
Source: FY2025 10-K, Note 7 — Acquisitions and Divestitures [8].
The December 2024 exit from Australia and Korea drove $39.5 million of divestiture-related charges in fiscal 2025, of which roughly $21.3 million was accumulated foreign-exchange losses recycled out of equity and $11.3 million an indemnification to the buyer — non-cash and one-time, not an operating deterioration [9]. What the sales left behind is a smaller but healthier segment. Revenue fell 8.7% to $599.9 million in fiscal 2025, but that was the divestitures at work; the retained portfolio grew 4.1% organically [10]. The operating margin more than tripled, from 1.2% to 3.7%, and for the first time sits inside management's stated 3%-to-7% target range "due to divesting more volatile elements of the portfolio" [11].
Management has framed the intent plainly: the segment "has tempered losses through a rebalancing of its contract portfolio and the divestiture of a number of operations as part of an effort to improve performance and deliver consistent profitability," and it anticipates "a smaller footprint once completed" [12]. The retained core is concentrated in the U.K. — including the Functional Assessment Services contract that replaced the prior HAAS work — and Australia's Workforce Australia program [13]. This is portfolio pruning working as intended; the reasonable read is that it improves quality of earnings even as it removes the diversification that a wider geographic footprint once provided.
U.S. Services: a policy-cycle trough, not erosion
The second non-Federal segment tells a different story. U.S. Services — state and local health-and-human-services work, chiefly Medicaid and ACA eligibility, enrollment, child support and employment programs — saw revenue fall 7.7% to $1.76 billion and its operating margin drop from 12.9% to 9.7% in fiscal 2025 [14]. On the numbers alone that looks like a deteriorating business. The cause, on management's account, is narrower: the prior year "contain[ed] excess volumes from Medicaid-related activities, including the extra redeterminations from the unwinding exercise," and "the higher margin in the prior year period was a direct benefit of the excess volumes that were temporary" [15].
Sources: FY2023–FY2025 from the FY2025 10-K segment note [16]; FY2022 as reported in prior filings.
The mechanism is the pandemic Medicaid cycle. During the COVID public-health emergency, states paused eligibility redeterminations; when the pause ended, the "unwinding" pushed a surge of redetermination work through Maximus's state contracts, lifting fiscal 2024 volumes and margins [17]. As that one-time caseload cleared, fiscal 2025 stepped back down. A meaningful portion of roughly $16 million in company-wide fourth-quarter severance charges also landed in the segment [18]. The segment's backlog is consistent with a trough rather than a decline: it edged up to $3.92 billion at September 30, 2025 from $3.87 billion a year earlier, even as revenue fell [19].
The forward case for the segment rests on the same statute the Recompete Durability chapter flagged as a company-wide tailwind. The 2025 One Big Beautiful Bill Act raises Medicaid adult-expansion redetermination frequency from annual to semi-annual and adds work-requirement verification, effective December 31, 2026, and Maximus is "a leading provider of such service to state governments" [20]. Management expects those provisions to "positively influence U.S. Services organic growth" but is candid that it is "not factoring them heavily into our fiscal year 2026 guidance," and that "the prospects in other program areas are actually more significant than those in the Medicaid sector" [21]. The trough read is well-supported; the recovery is an identified opportunity, not a booked one.
The concentration this leaves behind
Taken together, the two segments reveal a portfolio decision that the Federal-centric chapters do not capture on their own. Maximus is deliberately shrinking its international footprint and has just cycled its second-largest segment down off a policy-driven high — while the Federal engine grows. The company that results is a more concentrated bet on U.S. federal spending than it was three years ago, which is the same federal exposure the report weighs.
The non-Federal 44% of revenue is being reshaped in two directions at once: international pruned to a profitable core, U.S. Services troughing off a temporary Medicaid bulge. Both moves raise the quality of what remains and both raise the company's concentration in U.S. federal work.
That cuts two ways, and the evidence does not fully settle it. The constructive read is that management is doing exactly what a disciplined operator should — culling loss-making and volatile international operations, and treating a temporary state-Medicaid surge as temporary rather than extrapolating it — so the earnings that remain are higher-quality even if less diversified. The cautious read is that the diversification a bull might point to as ballast against federal budget risk is being actively reduced, at the same moment federal exposure is the market's principal worry.
Two observable items would tip the balance. First, whether U.S. Services revenue and margin stabilize near the fiscal 2025 level and then re-accelerate as the December 2026 Medicaid provisions take effect — or keep sliding, which would recast the FY2025 step-down as the start of a decline rather than a trough. Second, whether the trimmed Outside-the-U.S. segment holds inside its 3%-to-7% target range now that the volatile pieces are gone [22]. Neither is resolved today; both are checkable in the next few filings.
Capital Allocation
Maximus spent the past two years pivoting from paying down the debt it raised for its 2021 VES acquisition to buying back stock — roughly $457 million in fiscal 2025 and about $150 million more into fiscal 2026, at a blended cost near $78 a share [1]. The balance-sheet discipline is real: net leverage never left a 1.5–1.8x band against a stated 2.0–3.0x target [2]. The price discipline is harder to defend — most of those repurchased shares are underwater at $58.
From deleveraging to a buyback
The shape of Maximus's capital allocation is a debt story first. The company entered fiscal 2021 nearly debt-free, then paid roughly $1.36 billion of cash for VES, the veterans-medical-exam business, funding it with about $1.5 billion of new term debt [3]. Buybacks then stopped almost entirely — $3 million in fiscal 2021 and zero in fiscal 2023 — while free cash flow went to debt reduction, taking gross leverage to about 2.2x by September 2023 [4]. Through this stretch management's stated capital-deployment priorities were a growing dividend and acquisitions; repurchases were not on the list [5].
Source: reported cash-flow statements, FY2016–FY2025 10-Ks; the FY2025 figure of $447M is on a settlement (cash) basis, versus the ~$457M executed reported on the earnings call [6]; [7].
By fiscal 2025 the debt was worked down and buybacks resumed sharply. Maximus repurchased about 5.8 million shares for roughly $457 million — more than the prior nine fiscal years of buybacks combined — enabled by two board authorizations that lifted the program to $400 million in September 2025, superseding earlier $200 million resolutions [8] [9]. The buying has continued into fiscal 2026: about 1.4 million shares for $111 million in the March quarter and another 0.6 million for $40 million through May 1, alongside a fresh $400 million authorization effective May 11, 2026 [10].
That activity is the reason earnings-per-share can grow while revenue is flat. Weighted-average diluted shares fell from about 61.5 million in fiscal 2024 to 57.9 million in fiscal 2025, and to 54.6 million in the March 2026 quarter; shares actually outstanding were 53.1 million at March 31, 2026 [11].
Source: reported diluted share counts, FY2020–FY2025 10-Ks and Q2 FY2026 earnings release [12].
The price paid
The count is coming down. What it cost is the less flattering half of the story. Maximus's fiscal-2025 repurchases averaged about $79 a share, and the pace picked up in the September 2025 quarter at an average of $87.64 — near the stock's high before it fell to $58 [13]. Management framed the buying as value-driven: on the May 2026 call it said the "share price does not reflect the intrinsic value of the business" and pointed to "increased capital deployment toward share repurchases, given our view that our shares have been trading at an attractive valuation" [14]. Nine months on, that call has not yet paid off.
Source: FY2025 10-K Item 5 (Q4 average $87.64) [15]; Q4 FY2025 and Q2 FY2026 earnings calls [16] [17]; price per reported daily quotes.
Taken together, Maximus has repurchased roughly 7.8 million shares for about $608 million since October 2024 at a blended cost near $78. At $58.30, that block is worth about $455 million — an unrealized loss on the order of $150 million, or roughly a quarter of the capital deployed. The chart below places the buying against the price it paid: the heaviest purchases landed in the $79–88 zone of late 2025, not the low-$60s the stock reached in 2026.
Source: reported daily closing prices; the concentrated fiscal-2025 buying at ~$88 and the ~$79 March-2026 tranche sit near the top of this range [18].
The counter to a "bought high" reading is that the mark is not the point. The share reduction is permanent regardless of where the stock trades, and Maximus has kept buying as the price fell — from $87.64 in September 2025 to $66.67 by April 2026 — so it is averaging down rather than defending a single price. At today's roughly 15% forward free-cash-flow yield (Cash Conversion), each dollar retired claims more cash per remaining share than a dollar spent at $88 did. What would turn the read negative is a repeat of the fiscal-2025 pattern — the largest buying at the highest prices — rather than the current fall-following behavior.
The discipline that is real
Where management has been consistent is leverage. Its stated priority stack, unchanged across the period, runs organic-growth investment first, then a growing dividend, then disciplined acquisitions, with share repurchases last — all inside a 2.0–3.0x target net-debt ratio [19]. Actual leverage has stayed below that band throughout the buyback: 1.5x at September 2025, rising to 1.8x by March 2026 as short-term borrowing bridged the fiscal-2026 cash-collection gap, still well under the 4.0x credit-agreement covenant ceiling [20] [21]. Management was explicit that repurchases run "within the constraint of our stated target net debt ratio of 2x to 3x" and are sized against near-term liquidity and the acquisition pipeline [22].
That constraint has teeth. Because Maximus's cash arrives late in its fiscal year and leaned on a receivables facility through the fiscal-2026 squeeze (Cash Conversion), buyback capacity is genuinely bounded by liquidity, not just intent — an analyst on the May 2026 call pressed exactly this point [23]. The tension in the record is therefore narrow: management has been disciplined about how much balance sheet to commit and undisciplined, so far, about when to commit it.
The other two legs
The dividend, despite being the higher stated priority, is a token. The quarterly payout moved only from $0.28 in fiscal 2021–2023 to $0.30 for fiscal 2024 and 2025, then to $0.33 declared in April 2026 — about $1.32 annualized, or roughly 15% of guided adjusted earnings [24] [25]. It grows, but slowly enough that it is not where surplus cash goes.
Acquisitions, the third leg, have been quiet since VES. Investing outflows ran $54–129 million a year across fiscal 2022–2025 — capex and small tuck-ins, not another platform deal — even as management keeps saying it is "seeking acquisition targets" [26]. The practical result is that buybacks, officially the lowest priority, have been the swing use of cash: with the dividend fixed low and no deal on the table, repurchases absorbed the free cash flow.
For context, aggressive buyback is the norm in Maximus's own peer group. Science Applications International (SAIC) — one of the six companies Maximus benchmarks against [27] — repurchased about 4.0 million shares for roughly $422 million in its latest year under a $1.2 billion authorization, cutting its diluted count about 7% annually [28]. Maximus's fiscal-2025 step-up brought it into line with a cohort that has long treated buybacks as the primary return of capital; the distinctive feature is the timing, not the scale.
The buyback is the bridge from durable free cash flow to per-share value: management has committed the balance sheet responsibly — leverage below target throughout — but has so far paid prices the market has not validated, leaving the per-share case dependent on the free cash flow holding up rather than on the repurchases being well timed.
Management's own alignment is largely equity-based: the chief executive's fiscal-2025 pay was $11.2 million, roughly $6.9 million of it in stock awards [29]. Insider open-market activity has been limited to small, plan-based director sales, neither a vote of confidence nor a warning.
The De-Rating
At $58.30 Maximus trades at 6.9 times forward adjusted earnings, about six times forward adjusted EBITDA, and a 15.5% forward free-cash-flow yield — roughly half the 17-to-20-times earnings multiple it held for most of the prior decade. The 41% fall since January 2026 is a de-rating, not an earnings decline: management raised fiscal 2026 guidance twice while the stock dropped. Whether that is cheap turns on the durability the earlier chapters weighed, not on the current numbers, which are at records.
What the price implies
Discounted at 10%, Maximus's $58.30 price implies free cash flow declining about 5% a year in perpetuity, yet its direct 2025 federal-efficiency hit was about $4 million (0.07% of revenue) and it raised earnings guidance twice while peers ICF and SAIC absorbed 25% and roughly 3% revenue declines, while free cash flow merely holding flat would support about $90 a share [1] [2] [3].
The arithmetic behind that sentence is a reverse discounted-cash-flow read. Fiscal 2026 free cash flow at the $475 million midpoint is about $9.00 a share on 52.5 million shares [4]. Discounting that stream as a perpetuity at a 10% required return, the current $58.30 is consistent with free cash flow shrinking about 5% a year, forever. If instead it merely holds flat, the same discounting supports roughly $90 a share; low-single-digit growth supports more.
Source: derived from the fiscal 2026 free-cash-flow midpoint of $475M [5] and 52.5 million shares [6]; Gordon-growth perpetuity at a 10% discount rate.
The scenario the range is most sensitive to is the long-run growth rate, and that rate is downstream of two things the earlier chapters already examined: whether the essential-program franchise survives its recompetes (Recompete Durability) and whether the record margins hold once the fading volume bulge clears (Operating Leverage). A reader who accepts those chapters' calibrated read — revenue probably higher a decade out, margins structurally lifted — would put the durable path in the flat-to-growing band, where the arithmetic points well above the price. A reader who does not would note that the market is not pricing collapse: a slow decline, not a wind-down, and one that may be rational rather than fearful. SAIC has guided fiscal 2027 revenue to a further organic decline it attributes mainly to recompete losses [7], and Maximus faces its own concentrated recompete when the veterans-exam contract closes to all vendors on December 31, 2026 [8] — so the priced-in fade may reflect a rational, recompete-driven markdown of terminal value rather than fear. The gap between the two paths, roughly $58 versus $90-plus, is the investment case. The discount rate matters too but less: at a 9% required return the flat-free-cash-flow value rises to about $100, at 11% it falls to about $82.
Two honest haircuts sit inside the $475 million base. Part of fiscal 2024–25 profitability rode roughly three points of non-recurring volume that management is removing from the fiscal 2026 guide (Operating Leverage), and a normalised free-cash-flow figure nearer $400 million would lower every value in the table by about 15% — flat free cash flow then supports roughly $76 rather than $90. Even on that stricter base the price still implies a perpetual decline of around 3% a year.
A drawdown, not an earnings decline
Maximus peaked at $98.93 on January 22, 2026 and trades at $58.30, a 41% decline that erased roughly $2.4 billion of market value in under six months. Over the same window the business did not deteriorate. Fiscal 2025 closed with record adjusted EBITDA of $701.6 million (a 12.9% margin) and diluted earnings of $5.51 a share [9]. Then, as the price fell, management raised fiscal 2026 adjusted-EPS guidance in February to $8.05–$8.35 [10] and again in May to $8.25–$8.55 [11]. Earnings estimates rose while the equity repriced down by nearly half.
Price (Jul 17, 2026)
From Jan-2026 peak
Trailing P/E (GAAP)
Forward FCF yield
Sources: daily price series, as reported; FY2025 diluted EPS and FY2026 free-cash-flow guidance [12]; [13].
The clearest way to see the de-rating is the earnings multiple itself. For nine straight fiscal years through 2025, Maximus's stock closed the September fiscal year at 16.6 to 20.8 times trailing GAAP earnings — the single outlier, 28 times in 2023, reflected a temporarily depressed denominator during the post-pandemic margin trough, not an expensive stock. At $58.30 against fiscal 2025's $5.51, the trailing multiple is 10.6 times, close to half its own decade norm.
Source: derived from the daily price series and reported diluted EPS, FY2017–FY2025 Form 10-Ks; current multiple uses $58.30 over FY2025 EPS of $5.51 [14].
What the price pays for
On every metric that matches this cash-generative, lightly capitalised model, the stock screens cheap in absolute terms. Adjusted earnings of $7.36 for fiscal 2025 put the trailing adjusted multiple at 7.9 times; the raised fiscal 2026 midpoint of about $8.40 puts the forward multiple at 6.9 times [15]. Enterprise value — the $3.06 billion equity plus $1.38 billion of net debt at March 31, 2026 — is $4.44 billion, or 6.3 times trailing adjusted EBITDA and under six times the fiscal 2026 guide.
Sources: price and net debt as reported; FY2025 actuals and FY2026 guidance [16]; [17].
These numbers clear the hurdles a free-cash-flow buyer sets by a wide margin. Trailing free cash flow of $366 million against a $3.06 billion market capitalisation is a 12.0% yield; the fiscal 2026 guide of $450–500 million lifts the forward yield to about 15.5% [18]. Enterprise value at 6.3 times EBITDA sits far below the 12-times line at which the multiple alone would look full. The one qualifier a balance-sheet-first investor would flag is leverage: at roughly 1.9 times net debt to EBITDA this is not the net-cash balance sheet such a buyer prefers, though it is inside the tolerance a high free-cash-flow yield earns.
The cash behind the yield
The forward 15.5% yield is real but back-end-loaded, and that is the strongest fact against reading it as a clean run-rate. It requires operating cash flow to climb from $429 million in fiscal 2025 toward the $490–540 million embedded in the guide, and the first half of fiscal 2026 ran the other way: a $251 million free-cash-flow outflow in the December quarter, recovered only partly by $179 million in the March quarter, for a negative first half [19] [20]. The guide leans on a large second-half collection catch-up, the same September-quarter pattern that produced $642 million of free cash flow in the fourth quarter of fiscal 2025 [21]. It is also partly financed: the receivables-purchase facility and the collection timing behind the headline cash are dissected in the report's cash chapter (Cash Conversion). The point for valuation is narrow — the multiple looks low in part because a share of the cash it capitalises is timing-dependent, not because the market has missed it.
External marks and what would change the read
The thinnest external cross-check points the other way. The two analysts who publish targets carry a mean of $105 against the $58.30 price, both rated buy — but two estimators is scant coverage, and the targets have not repriced for the federal-budget and recompete fears that drove the fall, so this is weak corroboration, not confirmation. On tradability, the stock itself clears a value investor's size test comfortably: about $47 million changes hands daily and annual turnover runs above 250%, so a meaningful position is executable. The implied-volatility and long-dated-options questions a derivatives overlay would ask sit outside the filing record and need a market-data source; the closing chapter is the place to resolve them.
The measured read is that the drawdown is predominantly a de-rating of terminal value rather than a markdown of current cash flow: near-term earnings and free cash flow rose across the very months the multiple halved, and the price now implies a slow perpetual decline that the durability and margin chapters argue is more pessimistic than the evidence supports — while conceding the market is pricing a real, not imaginary, risk. What would change that read is checkable and dated: the outcome of the December 31, 2026 veterans-exam recompete, which sits under both the revenue and the margin at risk, and whether the second half of fiscal 2026 delivers the collection catch-up the free-cash-flow guide requires. Confirmation of either erosion would move the durable path from the flat-to-growing band toward the decline the price already assumes.
Bull and Bear
At $58.30 Maximus trades at roughly 6.9 times forward adjusted earnings and a 15.5% forward free-cash-flow yield after a 41% fall, even as management raised fiscal-2026 guidance twice on the way down [1]. The buy case is a cheap, cash-generative incumbent in mandatory government programs; the bear case is that the same revenue and record margins concentrate in one veterans-exam contract up for recompete on December 31, 2026, with reported cash flattered by a receivables facility. This chapter reconciles the two rather than declaring a winner.
What the company is
Maximus administers the back office of U.S. government benefit programs — Medicare and Marketplace help lines, Medicaid eligibility, welfare-to-work, student-loan servicing, and clinical exams for veterans — under multi-year contracts, with about 11% of revenue overseas (Government's Back Office). Roughly 88% of the $5.4 billion revenue base is government, about 60% sits in the ten largest contracts, and one federal agency supplies close to a fifth. The model is capital-light (capex 1–2% of revenue) and turns earnings into cash at about 1.3 times net income over a cycle (Cash Conversion). Backlog was $15.3 billion at September 30, 2025, about 2.8 times revenue [2].
What went wrong
The stock fell about 41%, from $98.93 on January 22, 2026 to $58.30 on July 17, 2026, without a matching fall in cash generation. Most of the move is sector-wide. The Department of Government Efficiency and a six-week federal government shutdown repriced the entire government-services group in 2025, and the damage at peers was real: ICF disclosed that revenue from federal clients fell 25% year on year in 2025 on contracts canceled between February and May plus the shutdown [3], and SAIC's full-year revenue declined about 3% organically with fiscal-2027 guided to further contraction it attributed mainly to recompete losses [4].
Maximus's own exposure to the efficiency drive has been slight — management sized the direct impact at about $4 million, "a de minimis figure on our base of $5 billion plus of revenue" [5]. What repriced its multiple were three company-specific worries: fiscal-2026 revenue guided flat-to-down ($5.2–5.35 billion against $5.43 billion), the December 31, 2026 recompete of the veterans-exam contract that anchors both revenue and margin, and a days-sales-outstanding spike at one federal customer that pushed first-half free cash flow negative. Over the same months, management raised fiscal-2026 adjusted-EPS guidance twice, to $8.25–8.55, and lifted the adjusted EBITDA margin guide to 14.2% [6]. The de-rating outran the change in the numbers, which is the setup the valuation chapter priced (The De-Rating).
FCF Yield (trailing)
FCF Yield (forward)
EV/EBITDA (fwd, x)
Adj P/E (fwd, x)
Source: derived from FY2025 free cash flow of $366.2M [7], FY2026 guidance of $450–500M FCF and $739–761M adjusted EBITDA [8], and market data as of 2026-07-17 (52.5M shares, ~$3.06B market cap, ~$1.38B net debt).
The buy case
Three things carry the bull argument, each cashed to a number.
First, the price capitalizes cash cheaply and the cash is real over a cycle. Trailing free cash flow of $366 million on a roughly $3.06 billion market cap is a 12% yield; the $450–500 million fiscal-2026 guide is 15.5% [9]. Over fiscal 2020–2025 operating cash flow ran about 1.5 times net income and the accrual test was benign (Cash Conversion).
Second, the franchise has defended itself. Management models a rebid win rate of "ninety percent, plus or minus three" that it says has held for five years, on mandatory, bipartisan programs that persist across administrations [10]. The efficiency drive that cut peers barely touched Maximus, and H.R.1's Medicaid work requirements and semi-annual redeterminations, effective December 31, 2026, are a fiscal-2027 volume tailwind that states will need third parties to administer (Recompete Durability).
Third, earnings are growing on flat revenue and the driver looks structural. U.S. Federal Services operating margin rose to 17.6% in the second quarter of fiscal 2026 from 15.3%, on just 1.5% ex-disaster organic growth, which management attributes to technology that "decouple[s] labor costs from our ability to process more volumes" — a concrete example being AI that organizes 5,500-page veterans' medical files [11], [12]. Management banked the durable half twice, raising the near-term adjusted EBITDA target range and the Federal margin guide (Operating Leverage). Discounted at 10%, Maximus's $58.30 price implies free cash flow declining about 5% a year in perpetuity, yet its direct 2025 federal-efficiency hit was about $4 million (0.07% of revenue) and it raised earnings guidance twice while peers ICF and SAIC absorbed 25% and roughly 3% revenue declines, while free cash flow merely holding flat would support about $90 a share [13].
Source: Gordon-growth reverse-DCF derived from the $475M FY2026 FCF midpoint (~$9.04/share on 52.5M shares) at a 10% discount rate; normalized base uses ~$400M mid-cycle FCF [14], [15]. Current price $58.30 as of 2026-07-17.
The bear case
The counter-argument does not need a collapse; it needs erosion, and it has four supports.
The recompete is concentrated, not diversified. The 90% win rate is a portfolio average; the veterans-exam work runs through December 31, 2026 for all vendors, the VA had not published a rebid timeline as of the May 2026 call, and management itself calls it "the largest" recompete [16]. Because that same clinical work drives the record Federal margin, a single adverse award hits both revenue and earnings (Operating Leverage).
The reported cash leans on a facility and on timing. Excluding the receivables-purchase facility — whose ceiling was raised from $250 million to $350 million — days sales outstanding at March 31, 2026 were 102 rather than the reported 78, and first-half operating cash flow was negative $54.9 million against a $450–500 million full-year free-cash-flow guide [17]. The year therefore depends on a September collection catch-up of the kind that produced $642 million of free cash flow in the fourth quarter of fiscal 2025 alone [18].
Part of the trailing base is a fading peak. Fiscal 2024–25 profit rode roughly 3 points of non-recurring volume (disaster support, a backlog-reduction push, the PACT Act ramp) that management is removing from the fiscal-2026 guide, and record Federal margins sit well above the 10–12% the segment targeted two years earlier [19]. On a normalized ~$400 million free-cash-flow base, the whole scenario ladder shifts down about 15%, and the priced-in decline is only about 3% a year — a lower bar for the bear to clear (The De-Rating).
And management paid up for its own stock. Maximus repurchased about 7.8 million shares for roughly $608 million since October 2024 at a blended ~$78, with the heaviest fiscal-2025 buying at $87.64; that block is worth about $455 million at $58.30 (Capital Allocation). The share reduction is permanent, but part of the drawdown is capital the company itself deployed above the current price.
The reconciliation
The bull and bear arguments do not dispute the facts; they read the same facts differently and are decided by different, checkable outcomes.
Sources: FY2026 guidance and buybacks [20]; win rate [21]; recompete [22]; margin and DSO [23], [24].
On the evidence, the drawdown looks predominantly like a terminal-value de-rating rather than a markdown of current cash generation: the company raised guidance twice as the stock halved, and even a normalized cash base leaves the price implying a slow perpetual decline. The strongest fact against that read is concentration — revenue and record margin sit in the same veterans-exam contract facing recompete, so one adverse 2026 award would validate more of the bear case than any macro fear. What would move the read is not sentiment but two dated events: the VA rebid outcome and whether the September collection catch-up arrives.
What to watch
Each item below is falsifiable, tied to a filing line, and carries a threshold that would change the read.
Sources: recompete and DSO targets [25], [26]; H.R.1 timing and buyback authorization [27].
A note on tradability
The equity clears a value investor's size test: average daily dollar volume runs near $47 million with annual turnover above 250%, so a position can be built and exited without moving the stock (The De-Rating). Realized volatility of roughly 33% (around its 80th percentile) is a reasonable proxy for how the market prices the recompete overhang. Live long-dated option liquidity and implied volatility — open interest and pricing on at-the-money contracts more than a year out — sit outside this corpus and could not be sourced from market data during this work; a reader who needs the options leg for position construction should pull it from a live options feed rather than infer it from the equity.
The report's central question resolves into these watch items. The price already pays for erosion; the evidence for durability is real but concentrated in one contract whose recompete lands within eighteen months.